HP hp39gPlus User Guide - Page 59
Building your own table of numbers
 |
UPC - 829160013138
View all HP hp39gPlus manuals
Add to My Manuals
Save this manual to your list of manuals |
Page 59 highlights
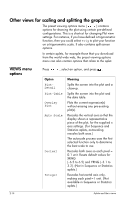
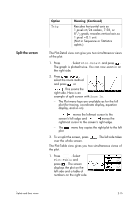
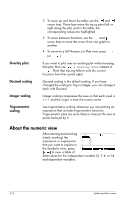
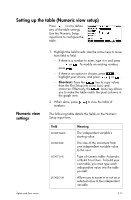
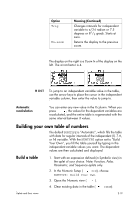
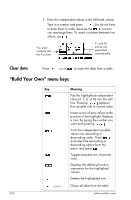
Option Trig Un-zoom Meaning (Continued) Changes intervals for independent variable to π/24 radian or 7.5 degrees or 81/3 grads. Starts at zero. Returns the display to the previous zoom. The display on the right is a Zoom In of the display on the left. The ZOOM factor is 4. HINT To jump to an independent variable value in the table, use the arrow keys to place the cursor in the independent variable column, then enter the value to jump to. Automatic recalculation You can enter any new value in the X column. When you press , the values for the dependent variables are recalculated, and the entire table is regenerated with the same interval between X values. Building your own table of numbers The default NUMTYPE is "Automatic", which fills the table with data for regular intervals of the independent (X, T, θ, or N) variable. With the NUMTYPE option set to "Build Your Own", you fill the table yourself by typing in the independent-variable values you want. The dependent values are then calculated and displayed. Build a table 1. Start with an expression defined (in Symbolic view) in the aplet of your choice. Note: Function, Polar, Parametric, and Sequence aplets only. 2. In the Numeric Setup ( NUM), choose NUMTYPE: Build Your Own. 3. Open the Numeric view ( ). 4. Clear existing data in the table ( CLEAR). Aplets and their views 2-19
-
 1
1 -
2
-
3
-
4
-
5
-
6
-
7
-
8
-
9
-
10
-
11
-
12
-
13
-
14
-
15
-
16
-
17
-
18
-
19
-
20
-
21
-
22
-
23
-
24
-
25
-
26
-
27
-
28
-
29
-
30
-
31
-
32
-
33
-
34
-
35
-
36
-
37
-
38
-
39
-
40
-
41
-
42
-
43
-
44
-
45
-
46
-
47
-
48
-
49
-
50
-
51
-
52
-
53
-
 54
54 -
 55
55 -
 56
56 -
 57
57 -
 58
58 -
 59
59 -
 60
60 -
 61
61 -
 62
62 -
 63
63 -
 64
64 -
65
-
66
-
67
-
68
-
69
-
70
-
71
-
72
-
73
-
74
-
75
-
76
-
77
-
78
-
79
-
80
-
81
-
82
-
83
-
84
-
85
-
86
-
87
-
88
-
89
-
90
-
91
-
92
-
93
-
94
-
95
-
96
-
97
-
98
-
99
-
100
-
101
-
102
-
103
-
104
-
105
-
106
-
107
-
108
-
109
-
110
-
111
-
112
-
113
-
114
-
115
-
116
-
117
-
118
-
119
-
120
-
121
-
122
-
123
-
124
-
125
-
126
-
127
-
128
-
129
-
130
-
131
-
132
-
133
-
134
-
135
-
136
-
137
-
138
-
139
-
140
-
141
-
142
-
143
-
144
-
145
-
146
-
147
-
148
-
149
-
150
-
151
-
152
-
153
-
154
-
155
-
156
-
157
-
158
-
159
-
160
-
161
-
162
-
163
-
164
-
165
-
166
-
167
-
168
-
169
-
170
-
171
-
172
-
173
-
174
-
175
-
176
-
177
-
178
-
179
-
180
-
181
-
182
-
183
-
184
-
185
-
186
-
187
-
188
-
189
-
190
-
191
-
192
-
193
-
194
-
195
-
196
-
197
-
198
-
199
-
200
-
201
-
202
-
203
-
204
-
205
-
206
-
207
-
208
-
209
-
210
-
211
-
212
-
213
-
214
-
215
-
216
-
217
-
218
-
219
-
220
-
221
-
222
-
223
-
224
-
225
-
226
-
227
-
228
-
229
-
230
-
231
-
232
-
233
-
234
-
235
-
236
-
237
-
238
-
239
-
240
-
241
-
242
-
243
-
244
-
245
-
246
-
247
-
248
-
249
-
250
-
251
-
252
-
253
-
254
-
255
-
256
-
257
-
258
-
259
-
260
-
261
-
262
-
263
-
264
-
265
-
266
-
267
-
268
-
269
-
270
-
271
-
272
-
273
-
274
-
275
-
276
-
277
-
278
-
279
-
280
-
281
-
282
-
283
-
284
-
285
-
286
-
287
-
288
-
289
-
290
-
291
-
292
-
293
-
294
 |
 |
