JVC VN-V685U White paper: Thermal Simulation is Key to JVC CCTV Product Relia - Page 6
graph expresses this information in terms of product longevity and CO - camera
 |
View all JVC VN-V685U manuals
Add to My Manuals
Save this manual to your list of manuals |
Page 6 highlights
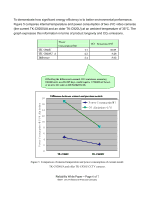
To demonstrate how significant energy efficiency is to better environmental performance, Figure 5 compares internal temperature and power consumption of two JVC video cameras (the current TK-C9200UA and an older TK-C920U) at an ambient temperature of 35°C. The graph expresses this information in terms of product longevity and CO2 emissions. TK -C920U TK -C9200U A Difference Power Consumption(W) CO Emissions (t/Y) 4.7 16.88 2.3 8.26 2.4 8.62 Offsetting the difference in annual CO2 emissions, assuming 100,000 units used 24/365 days, would require 1,724,000 m2 forest, or an area the same as 468 football fields P ow er C onsum ption (W )/C O ₂Em issions (t/Y) Difference between current and previous m odels 18 16 Power C onsum ption(W ) C O ₂Em issions (t/Y) 14 12 10 8 6 4 2 0 TK-C920U TK-C9200U Figure 5. Comparison of internal temperature and power consumption of current model TK-C9200UA and older TK-C920U CCTV cameras. Reliability White Paper - Page 6 of 7 ©2011 JVC Professional Products Company
-
 1
1 -
 2
2 -
 3
3 -
 4
4 -
 5
5 -
 6
6 -
 7
7
 |
 |
