Lantronix Spider KVM Over IP Switch Spider App. Note - Page 5
Interfaces, KVM Console Settings, Transmission Encoding set to, Keyboard/Mouse, Host Interface set
 |
View all Lantronix Spider KVM Over IP Switch manuals
Add to My Manuals
Save this manual to your list of manuals |
Page 5 highlights
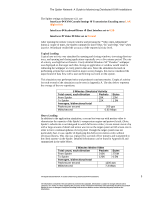
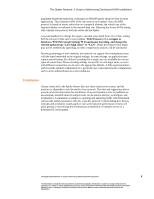
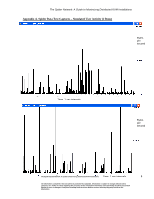
The Spider Network: A Guide to Maximizing Distributed KVM Installations The Spider settings on firmware v2.1 are: Interfaces KVM Console Settings Transmission Encoding set to LAN (high color) Interfaces Keyboard/Mouse Host Interface set to USB Interfaces Video Filter set to Normal After opening the remote console window and pressing the "Video Auto-Adjustment" button a couple of times, the Spider continued to show 0 Bps "In" and 0 Bps "Out" when inactive. Wineshark verified the accuracy of the reported activity level. Typical Loading Typical user activity was simulated by opening and closing windows, traversing directory trees, and opening and closing applications repeatedly over a five minute period. The rate of activity was high but not frenetic. Finely detailed Windows XP "Paradise" wallpaper was displayed on the target such that closing an application or window would result in redrawing the wallpaper at every pixel in that area. Since the simulation focused on performing actions that would result in major screen changes, this test is considered the upper bound of data flow with a user performing real work on the system. This simulation was performed twice and produced consistent results. Graphs of activity for each second of the simulation can be seen in Appendix A. The data below represent the average of the two repetitions. 5 Minutes Simulated Activity Total count, each direction Packets Bytes From Spider 29K 23M To Spider 22K 1.3M Averages, bidirectional total Packets per second 200 pps Mbits/second 0.65 Mbps Heavy Loading In addition to the application simulation, a second test was run with motion video to characterize the capacity of the Spider's compression engine and protocol stack. (Note, Spider's refresh rate is not designed to watch full screen video.) A one minute movie clip with a large amount of detail and action was run on the target system at full screen size in order to force continual updates of every pixel. Though the target system was not particularly fast, it was capable of displaying this full screen motion video without obvious jerkiness. This clip was replayed for a period of five minutes and transmitted to the client system via the Spider. Detailed information can be found in Appendix B and summarized in the table below. 5 Minutes Motion Video Total count, each direction Packets Bytes From Spider 242K 270M To Spider 120K 6.5M Averages, bidirectional total Packets per second 1200 pps Mbits/second 7.3 Mbps The Spider-Based Network: A Guide to Maximizing Distributed KVM Installations 5 The information contained in this document is protected by copyright. Information is subject to change without notice. Lantronix, Inc. makes no claim regarding the accuracy of this competitive information and specifically disclaims any and all liability for loss or damages of any kind resulting from decisions made or actions taken by any party based on this information.
-
 1
1 -
 2
2 -
 3
3 -
 4
4 -
 5
5 -
 6
6 -
 7
7 -
 8
8 -
 9
9 -
 10
10
 |
 |
