Lowrance HDS-12 Gen3 Operators Manual US - Page 42
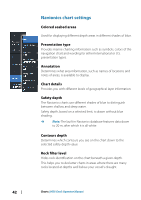
Navionics chart settings, Colored seabed areas, Presentation type, Annotation, Chart details
 |
View all Lowrance HDS-12 Gen3 manuals
Add to My Manuals
Save this manual to your list of manuals |
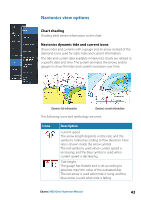
Page 42 highlights
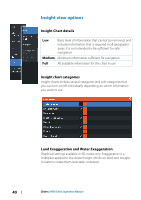
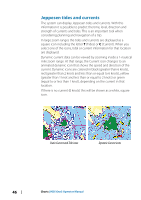
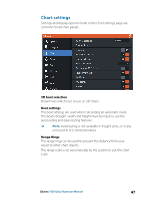
Navionics chart settings Colored seabed areas Used for displaying different depth areas in different shades of blue. Presentation type Provides marine charting information such as symbols, colors of the navigation chart and wording for either International or U.S. presentation types. Annotation Determines what area information, such as names of locations and notes of areas, is available to display. Chart details Provides you with different levels of geographical layer information. Safety depth The Navionics charts use different shades of blue to distinguish between shallow and deep water. Safety depth, based on a selected limit, is drawn without blue shading. Ú Note: The built in Navionics database features data down to 20 m, after which it is all white. Contours depth Determines which contours you see on the chart down to the selected safety depth value. Rock filter level Hides rock identification on the chart beneath a given depth. This helps you to declutter charts in areas where there are many rocks located at depths well below your vessel's draught. 42 Charts | HDS Gen3 Operator Manual
-
 1
1 -
2
-
3
-
4
-
5
-
6
-
7
-
8
-
9
-
10
-
11
-
12
-
13
-
14
-
15
-
16
-
17
-
18
-
19
-
20
-
21
-
22
-
23
-
24
-
25
-
26
-
27
-
28
-
29
-
30
-
31
-
32
-
33
-
34
-
35
-
36
-
 37
37 -
 38
38 -
 39
39 -
 40
40 -
 41
41 -
 42
42 -
 43
43 -
 44
44 -
 45
45 -
 46
46 -
 47
47 -
48
-
49
-
50
-
51
-
52
-
53
-
54
-
55
-
56
-
57
-
58
-
59
-
60
-
61
-
62
-
63
-
64
-
65
-
66
-
67
-
68
-
69
-
70
-
71
-
72
-
73
-
74
-
75
-
76
-
77
-
78
-
79
-
80
-
81
-
82
-
83
-
84
-
85
-
86
-
87
-
88
-
89
-
90
-
91
-
92
-
93
-
94
-
95
-
96
-
97
-
98
-
99
-
100
-
101
-
102
-
103
-
104
-
105
-
106
-
107
-
108
-
109
-
110
-
111
-
112
-
113
-
114
-
115
-
116
-
117
-
118
-
119
-
120
-
121
-
122
-
123
-
124
-
125
-
126
-
127
-
128
-
129
-
130
-
131
-
132
-
133
-
134
-
135
-
136
-
137
-
138
-
139
-
140
-
141
-
142
-
143
-
144
-
145
-
146
-
147
-
148
-
149
-
150
-
151
-
152
-
153
-
154
-
155
-
156
-
157
-
158
-
159
-
160
-
161
-
162
-
163
-
164
-
165
-
166
 |
 |
