Lowrance HDS-9 LIVE HDS Live Operator Manual - Page 98
StructureMap, About StructureMap, The StructureMap image, StructureMap sources
 |
View all Lowrance HDS-9 LIVE manuals
Add to My Manuals
Save this manual to your list of manuals |
Page 98 highlights
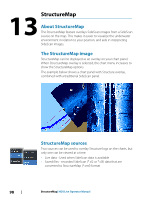
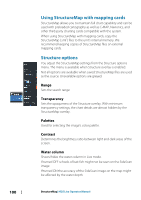
13 StructureMap About StructureMap The StructureMap feature overlays SideScan images from a SideScan source on the map. This makes it easier to visualize the underwater environment in relation to your position, and aids in interpreting SideScan images. The StructureMap image StructureMap can be displayed as an overlay on your chart panel. When StructureMap overlay is selected, the chart menu increases to show the StructureMap options. The example below shows a chart panel with Structure overlay, combined with a traditional SideScan panel. StructureMap sources Two sources can be used to overlay Structure logs on the charts, but only one can be viewed at a time: • Live data - Used when SideScan data is available • Saved files - recorded SideScan (*.sl2 or *.sl3) data that are converted to StructureMap (*.smf) format 98 StructureMap| HDS Live Operator Manual
-
 1
1 -
2
-
3
-
4
-
5
-
6
-
7
-
8
-
9
-
10
-
11
-
12
-
13
-
14
-
15
-
16
-
17
-
18
-
19
-
20
-
21
-
22
-
23
-
24
-
25
-
26
-
27
-
28
-
29
-
30
-
31
-
32
-
33
-
34
-
35
-
36
-
37
-
38
-
39
-
40
-
41
-
42
-
43
-
44
-
45
-
46
-
47
-
48
-
49
-
50
-
51
-
52
-
53
-
54
-
55
-
56
-
57
-
58
-
59
-
60
-
61
-
62
-
63
-
64
-
65
-
66
-
67
-
68
-
69
-
70
-
71
-
72
-
73
-
74
-
75
-
76
-
77
-
78
-
79
-
80
-
81
-
82
-
83
-
84
-
85
-
86
-
87
-
88
-
89
-
90
-
91
-
92
-
 93
93 -
 94
94 -
 95
95 -
 96
96 -
 97
97 -
 98
98 -
 99
99 -
 100
100 -
 101
101 -
 102
102 -
 103
103 -
104
-
105
-
106
-
107
-
108
-
109
-
110
-
111
-
112
-
113
-
114
-
115
-
116
-
117
-
118
-
119
-
120
-
121
-
122
-
123
-
124
-
125
-
126
-
127
-
128
-
129
-
130
-
131
-
132
-
133
-
134
-
135
-
136
-
137
-
138
-
139
-
140
-
141
-
142
-
143
-
144
-
145
-
146
-
147
-
148
-
149
-
150
-
151
-
152
-
153
-
154
-
155
-
156
-
157
-
158
-
159
-
160
-
161
-
162
-
163
-
164
-
165
-
166
-
167
-
168
-
169
-
170
-
171
-
172
-
173
-
174
-
175
-
176
-
177
-
178
-
179
-
180
-
181
-
182
-
183
-
184
-
185
-
186
-
187
-
188
-
189
-
190
-
191
-
192
-
193
-
194
-
195
-
196
-
197
-
198
 |
 |
