Oregon Scientific BPW810 User Manual - Page 7
sexual intercourse Beven, Honour & Stott, Clin. Sci.
 |
View all Oregon Scientific BPW810 manuals
Add to My Manuals
Save this manual to your list of manuals |
Page 7 highlights
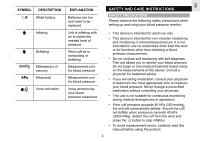
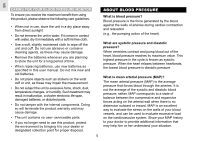
Diastolic blood pressure (mmHg) EN Why measure your blood pressure? Blood pressure measurement can highly reflect one's health condition. High blood pressure is potentially linked to serious illnesses such as stroke, heart disease and kidney failure. Since there is no symptom most of the time, many hypertensive people do not realize they are at risk until their health is seriously threatened. What is the standard blood pressure classification? Figure 3 illustrates the blood pressure classification made by World Health Organization (WHO) and International Society of Hypertension (ISH) in 1999. International Society of Hypertension Guidelines for the management of hypertension, Journal of Hypertension, 1999, 17(2): 151-183. NOTE • Blood pressure is considered high when either the diastolic or systolic blood pressure value exceeds the normal range. When a patient's systolic and diastolic blood pressures fall into different categories, the higher category should apply. • Only a physician can tell you your normal blood pressure range and the point at which you are at risk. Consult your physician to obtain these values. If the measurements taken with these products fall outside the range, consult your physician. Grade 3 hypertension(severe) 110 Grade 2 hypertension(moderate) 100 95 Grade 1 hypertension(mild) Subgroup: borderline 90 High-normal Blood Pressure 85 Normal Blood Pressure 80 Optimal Blood Pressure 120 130 140 150 160 170 180 sys tolic blood preesure(mmHg) Figure 3 Reference material: 1999 World Health Organization- Why does my blood pressure fluctuate throughout the day? Individual blood pressure varies greatly both on a daily and a seasonal or temperature basis. These variations may be more pronounced in hypertensive patients. Normally the blood pressure rises while at work and is at its lowest during sleep. The graph below illustrates the variations over a single day with measurement taken every 5 minutes. The thick line represents sleep time. The rises in blood pressure at 4PM (A in the graph) and 12AM (B in the graph) correspond to an attack of pain and sexual intercourse (Beven, Honour & Stott, Clin. Sci. 36:329, 1969). 6
-
 1
1 -
 2
2 -
 3
3 -
 4
4 -
 5
5 -
 6
6 -
 7
7 -
 8
8 -
 9
9 -
 10
10 -
 11
11 -
 12
12 -
13
-
14
-
15
-
16
-
17
-
18
-
19
-
20
 |
 |
