Seagate ST3146855LC Economies of Capacity and Speed: Choosing the most cost-ef - Page 2
Faster, Faster
 |
UPC - 836367003398
View all Seagate ST3146855LC manuals
Add to My Manuals
Save this manual to your list of manuals |
Page 2 highlights
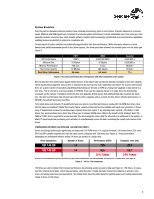
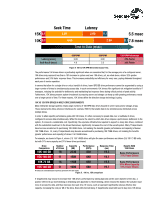
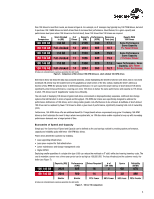
System Evolution Over the past two decades enterprise systems have achieved extraordinary gains in performance. Dramatic advances in processor speed, RAM size and RAM speed have combined to accelerate system performance to levels unthinkable just a few years ago. Such powerful hardware resources have made feasible software solutions with increasingly sophisticated and comprehensive capabilities, enabling business productivity to climb at a remarkable rate. Yet one aspect of system evolution has historically lagged behind: disc drive performance. While impressive advances in areal density have yielded exponential growth in disc drive capacity, disc drive speed has achieved only modest gains over the years (see Figure 2). CPU Performance Memory Size Memory Performance Disc Drive Capacity Disc Drive Performance 1987 1 MIPS 16 Kbytes 100 usec 20 Mbytes 60 msec 2004 2,000,000 MIPS 32 Gbytes 2 nsec 300 Gbytes 5.3 msec Increase 2,000,000 x 2,000,000 x 50,000 x 15,000 x 11 x Figure 2. Disc drive performance has not kept pace with other components of the system. Not only has disc drive performance lagged behind servers, it also hasn't kept up with the dramatic increases in disc drive capacity. These mushrooming capacities mean a drive is expected to do more (access more data) than ever before. For a given environment, there are a given number of operations (Input/Output Operations per Second, or IOPS) accessing each gigabyte of data stored on a disc drive. This is referred to as access density, or IOPS/GB. Every year the capacity offered on a single drive has dramatically increased, yet the number of actuators inside the drive (see Appendix A) that access that additional data has remained the sameone. The drive's performance has not kept pace with the drive's capacity, and as a result, the disc drive's effective performance, or IOPS/GB, has actually decreased over time. Yet in multi-drive environments, IT departments have been able to meet their performance needs with 10K-RPM disc drives. How has this been accomplished? Rather than buying higher capacity drives that become available with each new generation of drives, many IT departments continue to purchase lower capacity drives (see Figure 1). By selecting lower capacity, 10K 36GB or 73GB drives, they must purchase more drives than if they were to choose 300GB drives. What is the benefit of this strategy? Each 10K 36GB or 73GB drive is required to access less data, thus decreasing the chance that the drive will be a bottleneck in the system. In effect, IT departments are purchasing more actuators to simultaneously access the data, increasing the overall performance of the drives. COMPARISONS BETWEEN 10K-RPM AND 15K-RPM DISC DRIVES Server and storage performance significantly increases with 15K-RPM drives. For a typical workload, 15K drives deliver 32% more IOPS and 24% greater response time than the same server configured with 10K drives (see Figure 3). These performance advantages are maintained whether testing 14 drives (as shown) or a single drive. Drive Comparison Number of Drives Performance (IOPS) Response Time (ms) 10K 146 GB 14 725 22.1 15K 146 GB 14 955 16.7 32% Faster 24% Faster All values are calculated based on previous generation drive test results from IBM xSeries 335 with EXP 400:8KB, 2/3 random read, 1/3 random write, queue depth 16. Figure 3. 10K vs. 15K comparison 15K drives are able to deliver this increased performance by achieving quicker access to data (see Figure 4). 15K drives, of course, spin their internal discs faster, which reduces latency, while the discs' smaller diameter shortens the distance an actuator must move, decreasing seek time (see Appendix B). The smaller discs have the added benefit of yielding power and cooling requirements similar to those of 10K drives. 2
-
 1
1 -
 2
2 -
 3
3 -
 4
4 -
 5
5 -
 6
6 -
 7
7
 |
 |