Seagate ST3146855LC Economies of Capacity and Speed: Choosing the most cost-ef - Page 4
K 300 GB, 15K 146 GB, 10K 146 GB - specifications
 |
UPC - 836367003398
View all Seagate ST3146855LC manuals
Add to My Manuals
Save this manual to your list of manuals |
Page 4 highlights
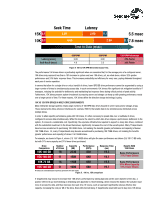
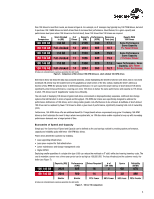
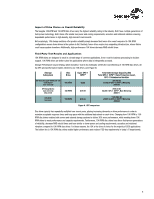
than 15K drives to meet their needs, as shown in Figure 6. For example, an IT manager may typically buy 10K 73GB drives, but elect to purchase 10K 146GB drives and short-stroke them to increase their performance. Nevertheless, for a given capacity and performance level (even when 10K drives are short-stroked), fewer 15K drives than 10K drives are required. Drive Comparison 10K 300 GB 15K 146 GB Short-Stroked to (GB) 140 GB Full-stroked # of Drives 15 14 Capacity Performance Response (GB) (IOPS) Time (ms) 2100 930 17.1 2044 965 16.7 Results With 15K Drives Same Performance Same Capacity 7% Fewer Drives 10K 146 GB 110 GB 14 1540 805 19.9 Same Performance Same Capacity 15K 146 GB Full-stroked 11 1606 840 19.2 21% Fewer Drives 10K 146 GB 110 GB 18 1980 925 17.3 Same Performance, Same Capacity, 22% Fewer 15K 146 GB Full-stroked 14 2044 960 16.7 Drives, Fewer Enclosures All values are calculated based on previous generation drive test results. Figure 6. Comparison of full-stroked 15K-RPM drives vs. short-stroked 10K-RPM drives Note that in these lab tests the data was accessed randomly, clearly highlighting the benefit of shorter seek times. But in real-world workloads I/O activity may be localized over a few gigabytes (a small section of the disc radius), making the drive's latency (a function of disc RPM) the primary factor in determining performance. In such cases the slower latency of short-stroked 10K drives significantly undermines performance, requiring even more 10K drives to deliver the same performance and capacity as 15K drives. In short, 15K drives meet IT departments' needs more efficiently. The net result of deploying 10K drives in typical multi-drive environments is disproportionately expensive, inefficient disc storage systems that still fall short in terms of speed and throughput. 15K-RPM disc drives were specifically designed to address the performance deficiencies of 10K drives, and in doing enable greater cost-effectiveness to be achieved. A multitude of short-stroked 10K drives can be replaced by fewer 15K drives to attain a given level of performance, significantly lowering total cost of ownership (TCO). Furthermore, 15K-RPM drives offer an additional benefit to IT departments whose requirements may grow: Purchasing 15K-RPM drives up front minimizes the need to buy a whole new system later, as 15K disc drives enable a system to keep up with increasing performance demands over a longer period of time. Economies of Speed and Capacity Simply put, the Economies of Speed and Capacity can be defined as the cost savings realized by meeting system performance, capacity and reliability goals with fewer 15K-RPM disc drives. Fewer drives benefit the customer by enabling: • Less supporting infrastructure • Less space required for that infrastructure • Lower maintenance and storage-management costs • Higher IOPS/U Deploying smaller quantities of a single drive type (15K) can reduce the workload on IT staff, while also lowering inventory costs. The cost to maintain a server over a three-year period can be as high as 100,000 USD. The less infrastructure the customer needs, the better (see Figure 7). Capacity (GB) 10K 146 GB 2628 Performance (IOPS) 925 Drives Required 18 # of EXP 400s 2 Space 6U Reliability (MTBF) 67K 15K 146 GB 2044 960 14 1 3U 86K Similar Similar 22% Fewer 50% Fewer 50% Less 28% Greater All values are calculated based on previous generation drive test results. Figure 7. 10K vs 15K comparison 4
-
 1
1 -
 2
2 -
 3
3 -
 4
4 -
 5
5 -
 6
6 -
 7
7
 |
 |