Seagate ST3146855LC Economies of Capacity and Speed: Choosing the most cost-ef - Page 3
Seek Time, Latency, 5 msec, 8 msec - price
 |
UPC - 836367003398
View all Seagate ST3146855LC manuals
Add to My Manuals
Save this manual to your list of manuals |
Page 3 highlights
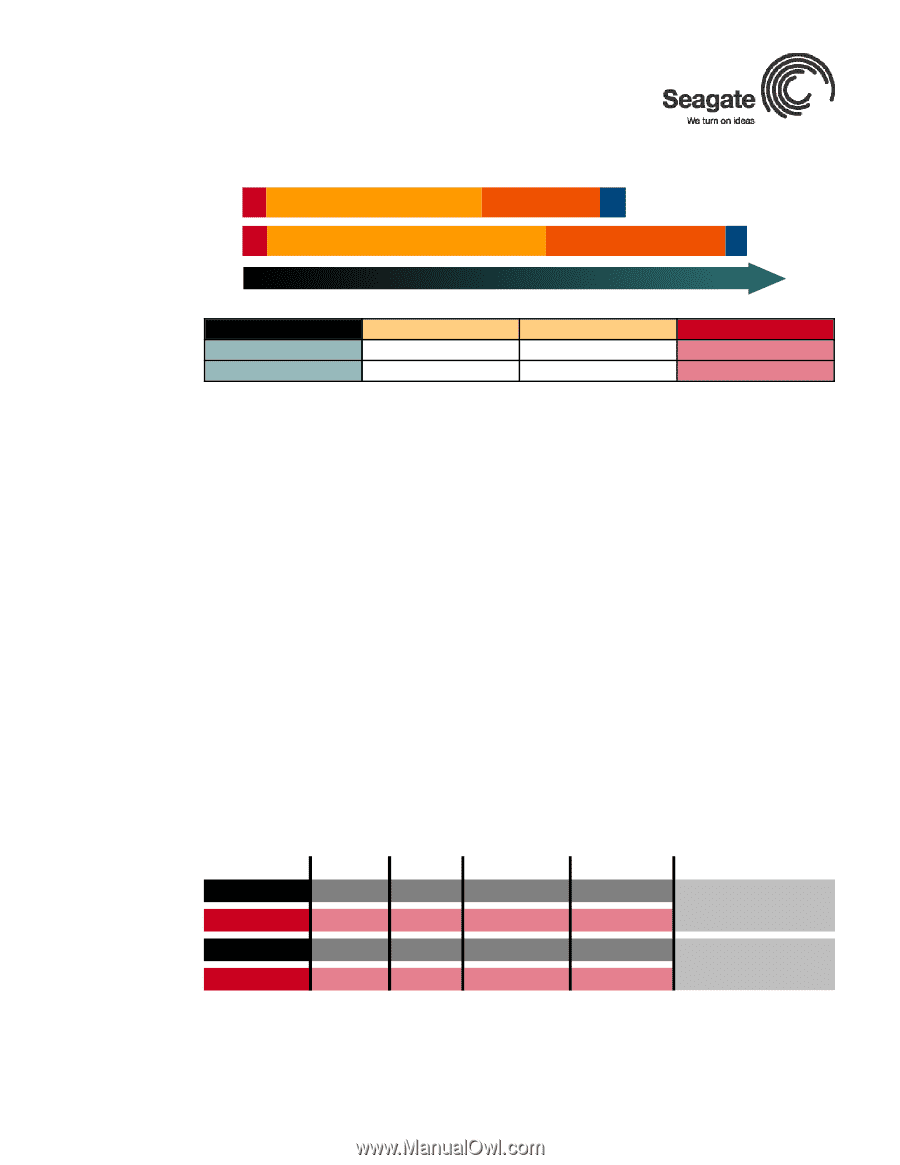
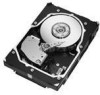
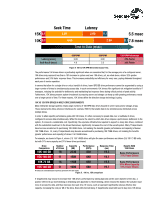
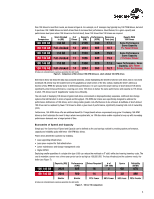
15K 0.1 10K 0.1 Seek Time 3.30 Latency 2.00 0.1 4.60 2.99 Time-to-Data (msec) 5.5 msec 0.1 7.8 msec Latency (msec) Seek Avg R (msec) 10K RPM 2.99 4.6 15K RPM 2.00 3.3 15K-RPM Advantage 33% Faster 30% Faster Figure 4. 10K vs 15K RPM Drive Data Access Time. The performance 15K drives deliver is particularly significant when one considers that, for the average price of a configured server, 15K drives may represent less than a 10% increase in system cost over 10K drives, yet, as noted above, deliver 32% greater performance and 24% faster response times. This increases productivity and efficiency for every user, paying dividends throughout each year of service operation. In servers that allow for a single drive or only a handful of drives, lower IOPS/GB drive performance cannot be augmented by using a larger number of drives to simultaneously access data. In such environments 15K drives offer significant risk mitigation benefits to IT managers, reducing the potential for bottlenecks and maintaining fast response times during critical periods of peak activity. Furthermore, 15K drives preserve system investment by ensuring server and storage can keep up with growing performance needs over a longer period of time. For these reasons, 15K drives define the direction storage technology is going. 10K VS 15K RPM DRIVES IN MULTI-DRIVE ENVIRONMENTS Many enterprise storage systems employ large numbers of 10K-RPM disc drives housed in server racks and/or storage arrays. These deployments utilize advanced interfaces (for example, RAID 5) that enable data to be simultaneously distributed across multiple drives. In order to attain specific performance goals with 10K drives, it's often necessary to spread data over a multitude of drives, configured to access data simultaneously. While this lessens the extent to which disc drives impose a performance bottleneck in the system, it comes at a considerable cost. Specifically, the expensive infrastructure required to support so many disc drives, combined with the substantial investment in the drives themselves, significantly increases the cost of the overall system. Many IT departments have become accustomed to purchasing 10K 36GB drives, not realizing the benefits (greater performance and capacity) of denser 15K 73GB drives. Or, many IT departments may become accustomed to purchasing 10K 73GB drives, not realizing the benefits (greater performance and capacity) of denser 15K 146GB drives. For example, as shown in Figure 5, eleven (11) 15K 146GB drives will give the same performance as sixteen (16) 10K 73 GB units, but with 37% more capacity and 31% fewer drives purchased. Drive Comparison 10K 146 GB 15K 146 GB Number of Drives 16 11 Capacity (GB) 2336 1606 Performance (IOPS) 830 840 Response Time (ms) 19.3 19.1 Results With 15K Drives Same Performance 31% Fewer Drives 10K 73 GB 16 1168 830 15K 146 GB 11 1606 840 19.3 Same Performance 37% More Capacity 19.1 31% Fewer Drives All values are calculated based on previous generation drive test results. Figure 5. 10K vs. 15K comparison IT departments may choose to increase their 10K drives' performance by storing data only on the outer diameter of the disc, a practice referred to as short-stroking or destroking (see Appendix C). Short-stroking a drive reduces the distance the actuator must move to access the data, and thus improves disc seek time. Of course, such an approach significantly reduces effective disc capacity, increasing the cost per GB of the drive. Even with short-stroking, IT departments would still need to buy more 10K drives
-
 1
1 -
 2
2 -
 3
3 -
 4
4 -
 5
5 -
 6
6 -
 7
7
 |
 |