TP-Link TL-SL2452 TL-SL2452 V1 User Guide 1910010972 - Page 144
Maintenance
 |
View all TP-Link TL-SL2452 manuals
Add to My Manuals
Save this manual to your list of manuals |
Page 144 highlights
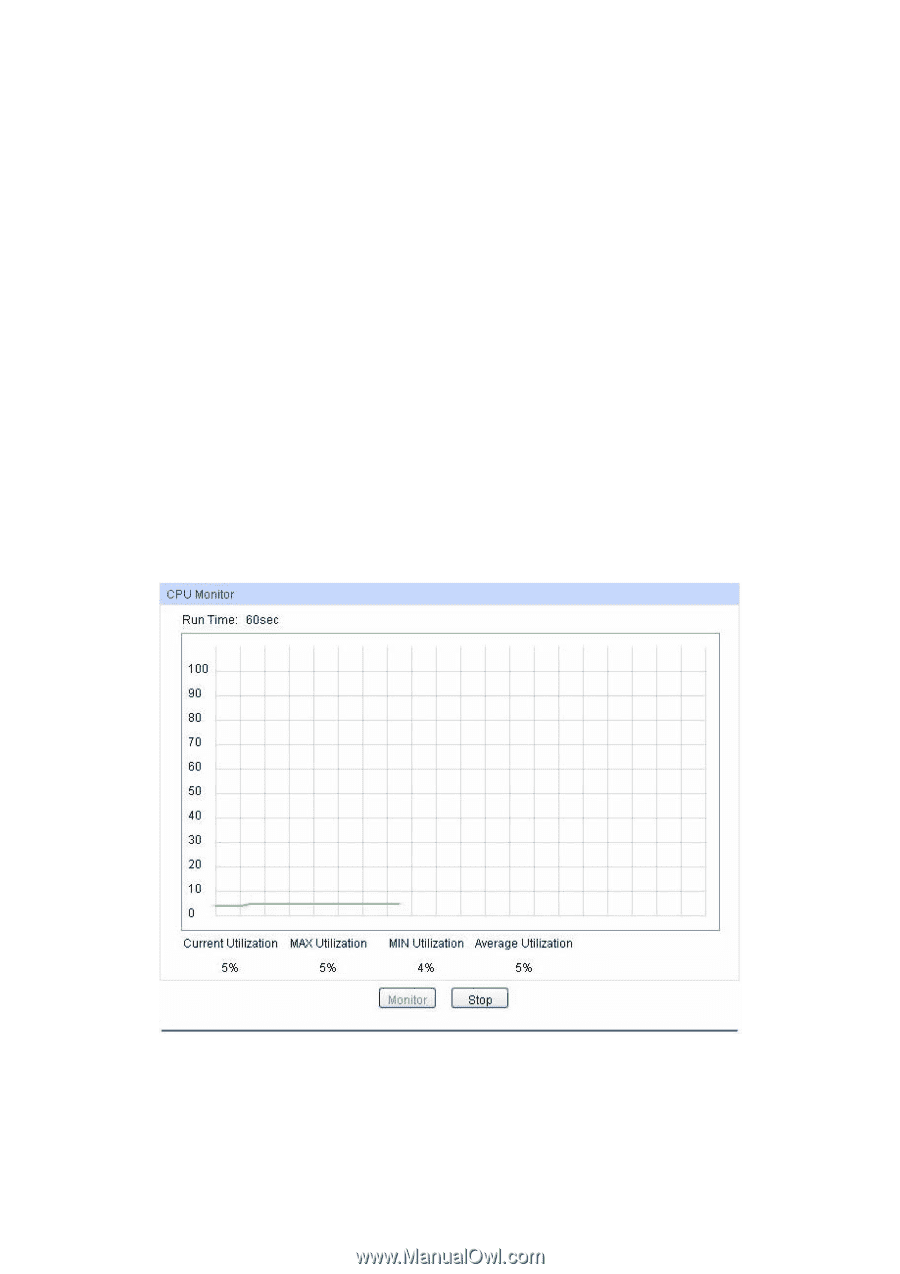
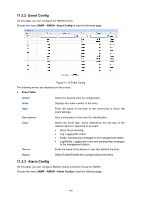
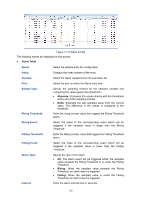
Chapter 12 Maintenance Maintenance module, assembling the commonly used system tools to manage the switch, provides the convenient method to locate and solve the network problem. (1) System Monitor: Monitor the utilization status of the memory and the CPU of switch. (2) Log: View the configuration parameters of the switch and find out the errors via the Logs. (3) Device Diagnostics: Test whether the ports of the switch and its peer device are available. (4) Network Diagnostics: Test whether the destination device is reachable and detect the route hops from the switch to the destination device. 12.1 System Monitor System Monitor functions to display the utilization status of the memory and the CPU of switch via the data graph. The CPU utilization rate and the memory utilization rate should fluctuate stably around a specific value. If the CPU utilization rate or the memory utilization rate increases markedly, please detect whether the network is being attacked. The System Monitor function is implemented on the CPU Monitor and Memory Monitor pages. 12.1.1 CPU Monitor Choose the menu Maintenance→System Monitor→CPU Monitor to load the following page. Figure 12-1 CPU Monitor Click the Monitor button to enable the switch to monitor and display its CPU utilization rate every four seconds. 137
-
 1
1 -
2
-
3
-
4
-
5
-
6
-
7
-
8
-
9
-
10
-
11
-
12
-
13
-
14
-
15
-
16
-
17
-
18
-
19
-
20
-
21
-
22
-
23
-
24
-
25
-
26
-
27
-
28
-
29
-
30
-
31
-
32
-
33
-
34
-
35
-
36
-
37
-
38
-
39
-
40
-
41
-
42
-
43
-
44
-
45
-
46
-
47
-
48
-
49
-
50
-
51
-
52
-
53
-
54
-
55
-
56
-
57
-
58
-
59
-
60
-
61
-
62
-
63
-
64
-
65
-
66
-
67
-
68
-
69
-
70
-
71
-
72
-
73
-
74
-
75
-
76
-
77
-
78
-
79
-
80
-
81
-
82
-
83
-
84
-
85
-
86
-
87
-
88
-
89
-
90
-
91
-
92
-
93
-
94
-
95
-
96
-
97
-
98
-
99
-
100
-
101
-
102
-
103
-
104
-
105
-
106
-
107
-
108
-
109
-
110
-
111
-
112
-
113
-
114
-
115
-
116
-
117
-
118
-
119
-
120
-
121
-
122
-
123
-
124
-
125
-
126
-
127
-
128
-
129
-
130
-
131
-
132
-
133
-
134
-
135
-
136
-
137
-
138
-
 139
139 -
 140
140 -
 141
141 -
 142
142 -
 143
143 -
 144
144 -
 145
145 -
 146
146 -
 147
147 -
 148
148 -
 149
149 -
150
-
151
-
152
-
153
-
154
-
155
-
156
-
157
-
158
 |
 |