Texas Instruments TI-30X Teachers Guide - Page 28
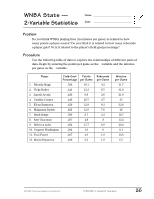
What is the average playing time? - 30xs calculator
 |
UPC - 033317198726
View all Texas Instruments TI-30X manuals
Add to My Manuals
Save this manual to your list of manuals |
Page 28 highlights
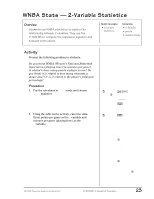
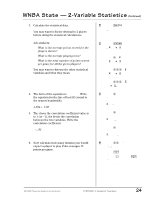
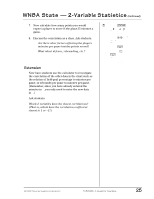
WNBA Stats - 2-Variable Statistics (Continued) 3. Calculate the statistical data. You may want to fix the decimal to 2 places before doing the statistical calculations. Ask students: • What is the average points scored for the players shown? • What is the average playing time? • What is the total number of points scored per game for all the given players? You may want to discuss the other statistical variables and what they mean. 4. The form of the equation is y = ax + b. Write the equation for the line of best fit (round to the nearest hundredth). 1.56x + 7.02 5. The closer the correlation coefficient value is to 1 (or –1), the better the correlation between the two variables. Write the correlation coefficient. r = .91 6. Now calculate how many minutes you would expect a player to play if she averages 15 points per game. 1. Press % ,. F0123456789 2. Press 2. 1. Press u. n Ï Sx Îx Ð 12.00 2. Press " to Ï. n Ï Sx Îx Ð 9.33 3. Press " " " to Ð. n Ï Sx Îx Ð 21.59 4. Press " " " to Òx. Sy Îy Òx 112.00 1. Press " until you get to a. This is the slope of the line of best fit. ÒXY a b r 1.56 2. Press " to b. This is the y-intercept of the line. Ò XY a b r 7.02 3. Press " to r. This is the correlation coefficient. ÒXY a b r 0.91 1. Press " " to y¢. x¢ y¢ 2. Press
-
 1
1 -
2
-
3
-
4
-
5
-
6
-
7
-
8
-
9
-
10
-
11
-
12
-
13
-
14
-
15
-
16
-
17
-
18
-
19
-
20
-
21
-
22
-
 23
23 -
 24
24 -
 25
25 -
 26
26 -
 27
27 -
 28
28 -
 29
29 -
 30
30 -
 31
31 -
 32
32 -
 33
33 -
34
-
35
-
36
-
37
-
38
-
39
-
40
-
41
-
42
-
43
-
44
-
45
-
46
-
47
-
48
-
49
-
50
-
51
-
52
-
53
-
54
-
55
-
56
-
57
-
58
-
59
-
60
-
61
-
62
-
63
-
64
-
65
-
66
-
67
-
68
-
69
-
70
-
71
-
72
-
73
-
74
-
75
-
76
-
77
-
78
-
79
-
80
-
81
-
82
-
83
-
84
-
85
-
86
-
87
-
88
-
89
-
90
-
91
-
92
-
93
-
94
-
95
-
96
-
97
-
98
-
99
-
100
-
101
-
102
-
103
-
104
-
105
-
106
-
107
-
108
-
109
-
110
-
111
-
112
-
113
-
114
 |
 |