Texas Instruments TI-30X Teachers Guide - Page 31
What is the average number of rebounds per game? - 30x calculator
 |
UPC - 033317198726
View all Texas Instruments TI-30X manuals
Add to My Manuals
Save this manual to your list of manuals |
Page 31 highlights
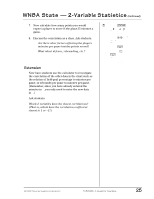
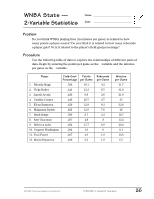
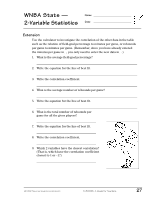
WNBA Stats - 2-Variable Statistics Name Date Extension Use the calculator to investigate the correlation of the other data in the table such as the relation of field-goal percentage to minutes per game, or rebounds per game to minutes per game. (Remember, since you have already entered the minutes per game in Y, you only need to enter the new data in X.) 1. What is the average field-goal percentage? 2. Write the equation for the line of best fit. 3. Write the correlation coefficient. 4. What is the average number of rebounds per game? 5. Write the equation for the line of best fit. 6. What is the total number of rebounds per game for all the given players? 7. Write the equation for the line of best fit. 8. Write the correlation coefficient. 9. Which 2 variables have the closest correlation? (That is, which have the correlation coefficient closest to 1 or –1?) © 1999 TEXAS INSTRUMENTS INCORPORATED TI-30X ÙS: A Guide for Teachers 27
-
 1
1 -
2
-
3
-
4
-
5
-
6
-
7
-
8
-
9
-
10
-
11
-
12
-
13
-
14
-
15
-
16
-
17
-
18
-
19
-
20
-
21
-
22
-
23
-
24
-
25
-
 26
26 -
 27
27 -
 28
28 -
 29
29 -
 30
30 -
 31
31 -
 32
32 -
 33
33 -
 34
34 -
 35
35 -
 36
36 -
37
-
38
-
39
-
40
-
41
-
42
-
43
-
44
-
45
-
46
-
47
-
48
-
49
-
50
-
51
-
52
-
53
-
54
-
55
-
56
-
57
-
58
-
59
-
60
-
61
-
62
-
63
-
64
-
65
-
66
-
67
-
68
-
69
-
70
-
71
-
72
-
73
-
74
-
75
-
76
-
77
-
78
-
79
-
80
-
81
-
82
-
83
-
84
-
85
-
86
-
87
-
88
-
89
-
90
-
91
-
92
-
93
-
94
-
95
-
96
-
97
-
98
-
99
-
100
-
101
-
102
-
103
-
104
-
105
-
106
-
107
-
108
-
109
-
110
-
111
-
112
-
113
-
114
 |
 |