3Com 3824 Implementation Guide - Page 60
Statistics, History, Alarms, Events, standard five traps required by SNMP link up, link down
 |
UPC - 662705467528
View all 3Com 3824 manuals
Add to My Manuals
Save this manual to your list of manuals |
Page 60 highlights
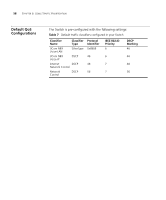
60 CHAPTER 7: STATUS MONITORING AND STATISTICS Statistics The Statistics group provides traffic and error statistics showing packets, bytes, broadcasts, multicasts and errors on a LAN segment or VLAN. Information from the Statistics group is used to detect changes in traffic and error patterns in critical areas of your network. History The History group provides historical views of network performance by taking periodic samples of the counters supplied by the Statistics group. The group is useful for analyzing the traffic patterns and trends on a LAN segment or VLAN, and for establishing the normal operating parameters of your network. Alarms The Alarms group provides a mechanism for setting thresholds and sampling intervals to generate events on any RMON variable. Alarms are used to inform you of network performance problems and they can trigger automated responses through the Events group. Events The Events group provides you with the ability to create entries in an event log and send SNMP traps to the management workstation. Events are the action that can result from an RMON alarm. In addition to the standard five traps required by SNMP (link up, link down, warm start, cold start, and authentication failure), RMON adds two more: rising threshold and falling threshold. Effective use of the Events group saves you time; rather than having to watch real-time graphs for important occurrences, you can depend on the Event group for notification. Through the SNMP traps, events can trigger other actions, therefore providing a way to automatically respond to certain occurrences.
-
 1
1 -
2
-
3
-
4
-
5
-
6
-
7
-
8
-
9
-
10
-
11
-
12
-
13
-
14
-
15
-
16
-
17
-
18
-
19
-
20
-
21
-
22
-
23
-
24
-
25
-
26
-
27
-
28
-
29
-
30
-
31
-
32
-
33
-
34
-
35
-
36
-
37
-
38
-
39
-
40
-
41
-
42
-
43
-
44
-
45
-
46
-
47
-
48
-
49
-
50
-
51
-
52
-
53
-
54
-
 55
55 -
 56
56 -
 57
57 -
 58
58 -
 59
59 -
 60
60 -
 61
61 -
 62
62 -
 63
63 -
 64
64 -
 65
65 -
66
-
67
-
68
-
69
-
70
-
71
-
72
-
73
-
74
-
75
-
76
-
77
-
78
-
79
-
80
-
81
-
82
-
83
-
84
-
85
-
86
-
87
-
88
-
89
-
90
-
91
-
92
-
93
-
94
-
95
-
96
-
97
-
98
-
99
-
100
-
101
-
102
 |
 |
