Casio FX 2.0 User Guide - Page 24
Graphs, Command List, Contents, Supplementary Information - graphic calculator
 |
UPC - 079767191139
View all Casio FX 2.0 manuals
Add to My Manuals
Save this manual to your list of manuals |
Page 24 highlights
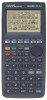
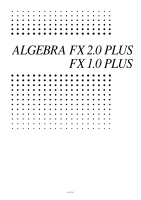
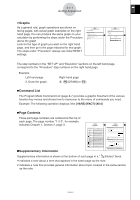
0-1-1 Getting Acquainted u Graphs As a general rule, graph operations are shown on facing pages, with actual graph examples on the right hand page. You can produce the same graph on your calculator by performing the steps under the Procedure above the graph. Look for the type of graph you want on the right hand page, and then go to the page indicated for that graph. The steps under "Procedure" always use initial RESET settings. 5-1-1 Sample Graphs 5-1 Sample Graphs k How to draw a simple graph (1) Description To draw a graph, simply input the applicable function. Set Up 1. From the Main Menu, enter the GRPH • TBL Mode. Execution 2. Input the function you want to graph. Here you would use the V-Window to specify the range and other parameters of the graph. See 5-3-1. 3. Draw the graph. 19990401 5-1-2 Sample Graphs Example To graph y = 3x2 Procedure 1 m GRPH-TBL 2 dvxw 3 5(DRAW) (or w) Result Screen 19990401 The step numbers in the "SET UP" and "Execution" sections on the left hand page correspond to the "Procedure" step numbers on the right hand page. Example: Left hand page 3. Draw the graph. Right hand page 3 5(DRAW)(or w) uCommand List The Program Mode Command List (page 8-7) provides a graphic flowchart of the various function key menus and shows how to maneuver to the menu of commands you need. Example: The following operation displays Xfct: [VARS]-[FACT]-[Xfct] uPage Contents Three-part page numbers are centered at the top of each page. The page number "1-2-3", for example, indicates Chapter 1, Section 2, page 3. uSupplementary Information 1-2-2 Display The following explains the meaning of each icon. Icon Mode Name RUN STATistics GRaPH-TaBLe DYNAmic graph RECURsion CONICS Description Use this mode for arithmetic calculations and function calculations, and for calculations involving binary, octal, decimal, and hexadecimal values and matrices. Use this mode to perform single-variable (standard deviation) and paired-variable (regression) statistical calculations, to perform tests, to analyze data and to draw statistical graphs. Use this mode to store functions, to generate a numeric table of different solutions as the values assigned to variables in a function change, and to draw graphs. Use this mode to store graph functions and to draw multiple versions of a graph by changing the values assigned to the variables in a function. Use this mode to store recursion formulas, to generate a numeric table of different solutions as the values assigned to variables in a function change, and to draw graphs. Use this mode to draw graphs of implicit functions. EQUAtion Use this mode to solve linear equations with two through six unknowns, quadratic equations, and cubic equations. PRoGraM Use this mode to store programs in th program area and to run programs. Computer Algebra Use this mode to perform algebraic calculations. Syetem ALGEBRA Use this mode for step-by-step solution of expressions. TUTORial LINK Use this mode to determine the expression type and solve mode, and for interactive equation solutions. Use this mode for step-by-step solution of expressions. MEMORY Use this mode to manage data stored in memory. SYSTEM Use this mode to initialize memory, adjust contrast, and to make other system settings. 19981001 1-2-3 Display k About the Function Menu Use the function keys (1 to 6) to access the menus and commands in the menu bar along the bottom of the display screen. You can tell whether a menu bar item is a menu or a command by its appearance. • Command (Example: ) Pressing a function key that corresponds to a menu bar command executes the command. • Pull-up Menu (Example: ) Pressing a function key that corresponds to a pull-up menu opens the menu. You can use either of the following two methods to select a command from a pull-up menu. • Input the key to the left of the command on the pull-up menu. • Use the f and c cursor keys to move the highlighting to the command you want, and then press w. The symbol ' to the right of a command indicates that executing the command displays a submenu. To cancel the pull-up menu without inputting the command, press i. k About Display Screens This calculator uses two types of display screens: a text screen and a graphic screen. The text screen can show 21 columns and 8 lines of characters, with the bottom line used for the function key menu. The graph screen uses an area that measures 127 (W) × 63 (H) dots. Text Screen Graph Screen The contents of each type of screen are stored in independent memory areas. The contents of each type of screen are stored in independent memory areas. #The contents of each type of screen are stored in independent memory areas. #The contents of each type of screen are stored in independent memory 19981001 Supplementary information is shown at the bottom of each page in a " (Notes)" block. * indicates a note about a term that appears in the same page as the note. # indicates a note that provides general information about topic covered in the same section as the note. 19990401
-
 1
1 -
2
-
3
-
4
-
5
-
6
-
7
-
8
-
9
-
10
-
11
-
12
-
13
-
14
-
15
-
16
-
17
-
18
-
 19
19 -
 20
20 -
 21
21 -
 22
22 -
 23
23 -
 24
24
 |
 |