Compaq ProLiant 1000 Performance of Microsoft Exchange Server 4.0 on Compaq Pr - Page 8
Performance Monitor, Configuration of Test Facility
 |
View all Compaq ProLiant 1000 manuals
Add to My Manuals
Save this manual to your list of manuals |
Page 8 highlights
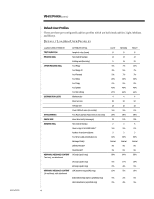
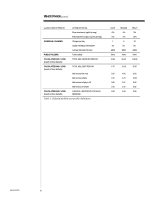
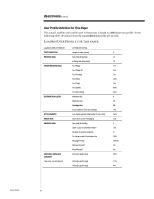
444A/0696 WHITE PAPER (cont.) 8... LoadSim Score The data point resulting from aLoadSim run is called theScore. The LoadSim Score represents a weighted average of the 95th percentile Exchange client response time (in milliseconds) of the various Exchange tasks. The read task is the highest weighted task - accounting for over half of the score. Many of the figures in this paper use the Score as a means of implying performance, i.e. a lower Score indicates better Exchange Server performance. Only you can determine the acceptable response time in your environment, but most administrators opt for one of two criteria: sub-second response time, or sub-3-second response time. Three seconds has been assumed as a safe upper limit for most graphs in this paper. Calculating the LoadSim Score The Score you see in the graphs of this paper are derived using the following process. 1. A LoadSim client simulates 100Medium users 2. LoadSim is configured to log data to disk. 3. All Loadsim runs are for at least four hours. 4. The 95th percentile LoadSim Score is then calculated from theLoadSim logs using the LSLOG utility. (Refer to the Microsoft white paper,L"oadSim: Microsoft Exchange Server Load Simulation Tool for Microsoft Exchange 4.0" for more information on LSLOG) 5. When running LSLOG, the first hour is thrown away, and only the second, third, and fourth hours are used for calculating the Score. 6. The Scores returned by LSLOG for all theLoadSim clients in the test are averaged. The mean Score is used as a data point on the graph. Performance Monitor The main tool used in monitoring and collecting the performance data contained in this paper is the Windows NT Performance Monitor P( erfMon). PerfMon monitors performance objects and counters within Windows NT, and it is these objects and counter which depict how the Exchange Server machine is performing under load. For more information on how to usePerfMon, refer to the Windows NT Resource Kit for Windows NT 3.51, Volume 4, 'Optimizing Windows NT'. Contained in the volume is a thorough treatment of PerfMon and some good suggestions for detecting bottlenecks. The principles outlined are relevant to monitoring performance of Exchange Server. Configuration of Test Facility The test facility is configured on two isolated 10BaseTethernet networks - one network for the LoadSim clients and one network for the data collection. This is to isolate the network traffic imposed by data collection from the actual test network traffic. Figur1e is a representation of the network topology. There are 15 LoadSim client machines. As stated earlier, aLoadSim client is simply a Windows NT machine that is configured with the Microsoft Exchange client software anLd oadSim. A single LoadSim client can simulate multiple users. In this case, each of the 15LoadSim clients simulate 100 users. The load imposed by each user is based on the profile outlined previously in Table 2.
-
 1
1 -
2
-
 3
3 -
 4
4 -
 5
5 -
 6
6 -
 7
7 -
 8
8 -
 9
9 -
 10
10 -
 11
11 -
 12
12 -
 13
13 -
14
-
15
-
16
-
17
-
18
-
19
-
20
-
21
-
22
 |
 |