Dell PowerConnect W-IAP175P Dell Instant 6.2.0.0-3.2.0.0 User Guide - Page 243
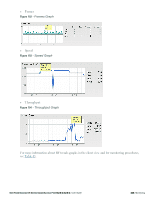
Client View, Study the Errors graph.
 |
View all Dell PowerConnect W-IAP175P manuals
Add to My Manuals
Save this manual to your list of manuals |
Page 243 highlights
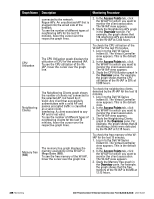
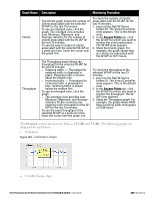
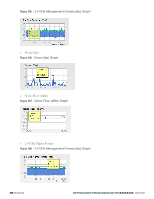
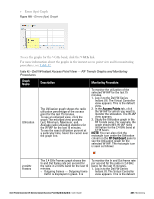
Graph Name Frames Errors Description Monitoring Procedure in and out of the radio in the 2.4 GHz band for the last 15 minutes. Note that the scale for the Y-axis is logarithmic. To see the exact number of management frames per second at a particular time, hover the cursor over the graph lines. last 15 minutes, 1. Log in to the Dell W-Series Instant UI. The Virtual Controller view appears. This is the default view. 2. In the Access Points tab, click the name link of the W-IAP for which you want to monitor the noise floor. The W-IAP view appears. 3. Study the 2.4 GHz Mgmt Frames graph. For example, the graph shows that 3 management frames were out of the radio at 13:50 hours. The Errors graph shows the errors that occurred while receiving the frames for the last 15 minutes. The errors are measured in frames per second. To see an enlarged view, click the graph. The enlarged view provides Last, Minimum, Maximum, and Average statistics for the In and Out frames. To see the exact utilization percent at a particular time, hover the cursor over the graph line. To monitor the errors for the W-IAP for the last 15 minutes, 1. Log in to the Dell W-Series Instant UI. The Virtual Controller view appears. This is the default view. 2. In the Access Points tab, click the name link of the W-IAP for which you want to monitor the errors. The W-IAP view appears. 3. Study the Errors graph. For example, the graph shows that the errors for the W-IAP at 13:32 hours is 22 frames per second. NOTE: You can also click the rectangle icon under the Errors column in the RF Dashboard pane to see the Errors graph for the selected W-IAP. Client View In the Virtual Controller view, all clients in the Dell W-Instant network are listed in the Clients tab. Click the IP address of the client that you want to monitor. Client view for that client appears. The Client view has three tabs- Networks, Access Points, and Clients. The following sections in the Dell W-Series Instant UI provide information about the selected client: l Info l RF Dashboard l RF Trends l Usage Trends Dell PowerConnect W-Series Instant Access Point 6.2.0.0-3.2.0.0 | User Guide 243 | Monitoring
-
 1
1 -
2
-
3
-
4
-
5
-
6
-
7
-
8
-
9
-
10
-
11
-
12
-
13
-
14
-
15
-
16
-
17
-
18
-
19
-
20
-
21
-
22
-
23
-
24
-
25
-
26
-
27
-
28
-
29
-
30
-
31
-
32
-
33
-
34
-
35
-
36
-
37
-
38
-
39
-
40
-
41
-
42
-
43
-
44
-
45
-
46
-
47
-
48
-
49
-
50
-
51
-
52
-
53
-
54
-
55
-
56
-
57
-
58
-
59
-
60
-
61
-
62
-
63
-
64
-
65
-
66
-
67
-
68
-
69
-
70
-
71
-
72
-
73
-
74
-
75
-
76
-
77
-
78
-
79
-
80
-
81
-
82
-
83
-
84
-
85
-
86
-
87
-
88
-
89
-
90
-
91
-
92
-
93
-
94
-
95
-
96
-
97
-
98
-
99
-
100
-
101
-
102
-
103
-
104
-
105
-
106
-
107
-
108
-
109
-
110
-
111
-
112
-
113
-
114
-
115
-
116
-
117
-
118
-
119
-
120
-
121
-
122
-
123
-
124
-
125
-
126
-
127
-
128
-
129
-
130
-
131
-
132
-
133
-
134
-
135
-
136
-
137
-
138
-
139
-
140
-
141
-
142
-
143
-
144
-
145
-
146
-
147
-
148
-
149
-
150
-
151
-
152
-
153
-
154
-
155
-
156
-
157
-
158
-
159
-
160
-
161
-
162
-
163
-
164
-
165
-
166
-
167
-
168
-
169
-
170
-
171
-
172
-
173
-
174
-
175
-
176
-
177
-
178
-
179
-
180
-
181
-
182
-
183
-
184
-
185
-
186
-
187
-
188
-
189
-
190
-
191
-
192
-
193
-
194
-
195
-
196
-
197
-
198
-
199
-
200
-
201
-
202
-
203
-
204
-
205
-
206
-
207
-
208
-
209
-
210
-
211
-
212
-
213
-
214
-
215
-
216
-
217
-
218
-
219
-
220
-
221
-
222
-
223
-
224
-
225
-
226
-
227
-
228
-
229
-
230
-
231
-
232
-
233
-
234
-
235
-
236
-
237
-
 238
238 -
 239
239 -
 240
240 -
 241
241 -
 242
242 -
 243
243 -
 244
244 -
 245
245 -
 246
246 -
 247
247 -
 248
248 -
249
-
250
-
251
-
252
-
253
-
254
-
255
-
256
-
257
-
258
-
259
-
260
-
261
-
262
-
263
-
264
-
265
-
266
-
267
-
268
-
269
-
270
-
271
-
272
-
273
-
274
-
275
-
276
-
277
-
278
-
279
-
280
-
281
-
282
-
283
-
284
-
285
-
286
-
287
-
288
-
289
-
290
-
291
-
292
-
293
-
294
-
295
-
296
 |
 |