HP ProLiant DL288 HP Power Regulator for ProLiant servers - Page 10
Power management and reporting, Insight Power Manager
 |
View all HP ProLiant DL288 manuals
Add to My Manuals
Save this manual to your list of manuals |
Page 10 highlights
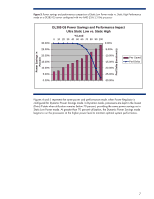
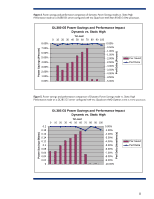
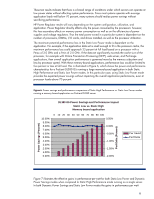
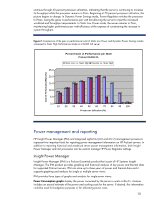
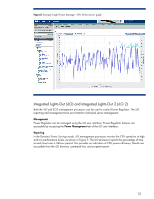
Gain in Performance/Watt (%) continue through 60 percent processor utilization, indicating that the server is continuing to increase its throughput while the processor remains in Pmin. Beginning at 70 percent processor utilization, the picture begins to change. In Dynamic Power Savings mode, Power Regulator switches the processor to Pmax, losing the gains in performance per watt but allowing the server to meet the increased workload and throughput requirements. In Static Low Power mode, the server remains in Pmin, maintaining higher performance per watt efficiency at the expense of constraining the increase in system throughput. Figure 7. Comparison of the gain in performance/watt of Static Low Power and Dynamic Power Savings modes compared to Static High Performance mode on a DL385 G5 server Percent Gain in Performance per Watt ProLiant DL385 G5 Static Low vs. Static High Dynamic vs. Static High 25.0 20.0 15.0 10.0 5.0 0.0 10 20 30 40 50 60 70 80 90 100 Processor Utilization (%) Power management and reporting HP Insight Power Manager (IPM) and Integrated Lights-Out (iLO and iLO 2) management processors represent two important tools for reporting power management information on HP ProLiant servers. In addition to reporting historical and analytical server power management information, both Insight Power Manager and iLO processors can be used to manage HP Power Regulator settings. Insight Power Manager Insight Power Manager (IPM) is a ProLiant Essentials product that is part of HP Systems Insight Manager. The IPM product provides graphing and historical analysis of key power and thermal data for supported ProLiant servers. IPM can store up to three years of power and thermal data and it supports graphing and analysis for single or multiple server views. IPM provides three types of graphs and analysis for single-server views: Power Consumption graphs display the power consumed by the server in watts or Btu/hr. Analysis includes an annual estimate of the power and cooling costs for the server. If desired, this information could be used for budgetary purposes or for allocating power costs. 10
-
 1
1 -
2
-
3
-
4
-
 5
5 -
 6
6 -
 7
7 -
 8
8 -
 9
9 -
 10
10 -
 11
11 -
 12
12 -
 13
13 -
 14
14 -
 15
15 -
16
-
17
 |
 |
