HP ProLiant DL288 HP Power Regulator for ProLiant servers - Page 11
Group Inlet Air Temperature Breakdown, Group Power Consumption Breakdown
 |
View all HP ProLiant DL288 manuals
Add to My Manuals
Save this manual to your list of manuals |
Page 11 highlights
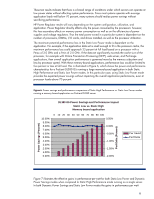
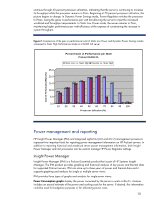
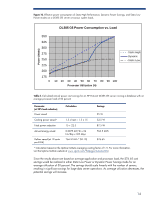
CPU Performance graphs display the average utilization of the server and the average CPU frequency of the server (see Figure 8). The average CPU frequency graphs the result of the system moving in and out of different processor P-states. In HP Dynamic Power Saver mode, this graph shows the CPU moving to a higher frequency as the server becomes busier and requires additional performance. Analysis includes an estimate of the power and money saved through the use of HP Power Regulator technology. Inlet Air Temperature graphs display the temperature of the air coming into the server. Most of the power consumed by the server is exhausted as heat into the data center. This graphic display shows the thermal environment in which the server is operating. IPM also provides four types of graphs and analysis for multiple-server views: Group Power Consumption graphs display in watts or Btu/hr a summary of the power consumed by the collection of servers. Analysis includes an annual estimate of the power and cooling costs for the collection of servers. Group Power Consumption Breakdown graphs display the individual power consumed by each server in the collection. Analysis includes the server with the highest average and peak consumption and the theoretical peak consumption that would occur if all servers encountered peak consumption simultaneously. Group Inlet Air Temperature graphs display the average temperature of the air coming into the servers in the collection. Analysis includes the temperature trend for the collection. Group Inlet Air Temperature Breakdown graphs display the individual temperature of the air coming into each server in the collection. This type of graph is useful for comparing data center temperatures in different parts of the data center or the temperature change for servers in a rack. Insight Power Manager also supports changing the Power Regulator mode for one to many ProLiant servers. System Administrators can make Power Regulator changes interactively through the web user interface or schedule the changes to occur at specific and recurring times. For additional information and supported servers go to http://www.hp.com/go/ipm 11
-
 1
1 -
2
-
3
-
4
-
5
-
 6
6 -
 7
7 -
 8
8 -
 9
9 -
 10
10 -
 11
11 -
 12
12 -
 13
13 -
 14
14 -
 15
15 -
 16
16 -
17
 |
 |