Motorola 8167 User Manual - Page 26
Motorola Management's Discussion and Analysis
 |
View all Motorola 8167 manuals
Add to My Manuals
Save this manual to your list of manuals |
Page 26 highlights
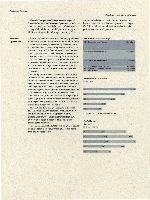
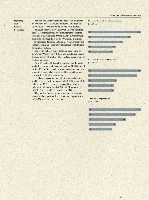
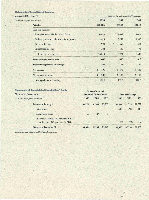
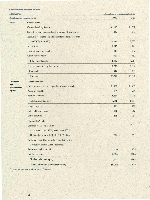
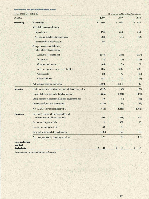
Financial Review Motorola, Inc. and Consolidated Subsidiaries Motorola Management's Discussion and Analysis of Financial Condition and Results of Operations includes the Financial Results section of the Letter to Stockholders on pages 3 4 and the Review of Operations on pages 19-23, in addition to the following commentary. This commentary should be read in conjunction with the financial statements and footnotes, presented on pages 27-36, for a full understanding of Motorola's financial position and results of operations. Results of Operation* Motorola's 1990 sales were $10.88 billion, up 13% from $9.62 billion in 1989.1988 sales were $8.25 billion. International market sales, as measured by the locale of the end customer, have shown strong growth, with a 24.2% increase over 1989. The General Systems Products segment again contributed the highest rate of growth and now represents 23% of total sales, up from 19% in 1989. Sales in the fourth quarter were $2.93 billion as compared to $2.65 billion in the same period of 1989, or an 11% increase. Earnings per share were 82 cents for the quarter as compared to $1.01 in the same period a year earlier. Operating profit from all segments was $951 million in 1990, up from $895 million in 1989. In 1988 operating profit was $804 million. The General Systems Products segment maintained its position as Motorola's most profitable segment in 1990. However, the Semiconductor Products segment showed the most improvement in 1990. Net earnings of $499 million in 1990 were flat as compared to 1989, with 1990 per share earnings of $3.80 down slightly on increased shares outstanding, compared to 1989 per share earnings of $3.83. In 1988, Motorola earned $445 million or $3.43 per share. Research and development expenditures increased to $1.01 billion in 1990, up from $810 million in 1989 and $665 million in 1988. As a percent of sales, Motorola continues to invest slightly less than 10% of every sales dollar in product development and technological advances. Income taxes. The effective tax rate for 1990 of 25% is up only slightly from the 1989 rate of 23% and down from the 1988 rate of 27%. 1990 Net Sales by Business Segment 32% Communications Products ^ ^ ^ ^ ^ HK' W 30% Semiconductor Products 23% General Systems Products 5% Information Systems Products 6% Government Electronic Products 4% Other Products International Market Sales* (In millions) 1,689 Ms measured by the locale of the end customer. Profit Margins (In percent) A Operating • Net $3.6 billion $3.4 billion $2.6 billion. $599 million $685 million $436 million 87 4.6% 24
-
 1
1 -
2
-
3
-
4
-
5
-
6
-
7
-
8
-
9
-
10
-
11
-
12
-
13
-
14
-
15
-
16
-
17
-
18
-
19
-
20
-
 21
21 -
 22
22 -
 23
23 -
 24
24 -
 25
25 -
 26
26 -
 27
27 -
 28
28 -
 29
29 -
 30
30 -
 31
31 -
32
-
33
-
34
-
35
-
36
-
37
-
38
-
39
-
40
-
41
-
42
-
43
-
44
 |
 |
