Motorola 8167 User Manual - Page 36
Depreciation
 |
View all Motorola 8167 manuals
Add to My Manuals
Save this manual to your list of manuals |
Page 36 highlights
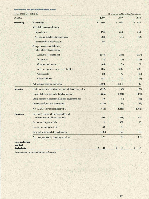
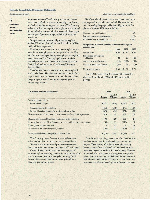
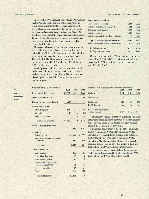
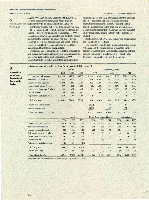
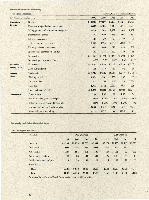
Notes to Consolidated Financial Statements (In millions, except as noted) Motorola, Inc. and Consolidated Subsidiaries 8 During 1990, the Company adopted SFAS 105, which requires disclosure of information about financial Commitments and instruments with off-balance-sheet risk and about Contingencies concentration of credit risk for all financial instruments. The Company had $446 million of forward foreign ex- change contracts outstanding as of December 31,1990. Management believes that these forward contracts should not subject the Company to undue risk due to foreign exchange movements because gains and losses on these contracts should offset losses and gains on the assets, liabilities and transactions being hedged. Obligations under commitments to extend or guarantee financing and recourse under receivable sale arrangements aggregated $262 million as of December 31,1990. Commitments to extend or guarantee financing include commitments for customer financing and for the financing . of non-consolidated affiliates. Customer financing commitments require the customer to meet certain conditions established in the financing arrangements. Commitments represent the maximum amounts available under these arrangements and may not be completely utilized. As of December 31,1990, the Company had no significant concentrations of credit risk. The Company is a defendant in various suits and claims which arise in the normal course of business. In the opinion of management, the ultimate disposition of these matters will not have a material adverse effect on the business or financial position of the Company. 9 Infermcrtien by Industry Segment and Region Industry segment information as of and for die years ended December 31 Communications Products 1990 8 3,560 Net Sales 1989 1988 $3,310 $3,017 vm) $225 6.3% Semiconductor Products 3,433 3,036 2,741 314 9.2% General Systems Products Information Systems Products Government Electronic Products 2,648 599 685 1,902 552 698 1,102 566 648 352 13.3% (1) (.2%) 60 8.8% Other Products Adjustments and eliminations 436 (476) 490 (368) 481 (305) - .1% 1 - 4Operating Profit 1989 $302 9.1% 189 6.2% 340 17.9% 18 3.2% 46 6.6% 4 .7% (4) - 1988 $326 10.8% 268 9.8% 107 9.7% 68 12.0% 25 3.8% 19 4.0% (9) - Industry totals 810,885 $9,620 $8,250 951 8.7% 895 9.3% 804 9.7% General corporate expenses Interest expense, net (152) (119) (94) (133) (130) (98) Earnings before income taxes $666 6.1% $646 6.7% $612 7.4% Communications Products Semiconductor Products General Systems Products Information Systems Products Government Electronic Products Other Products Adjustments and eliminations 1990 $2,616 2,851 1,503 386 363 304 (20) Assets 1989 $2,348 2,590 1,139 403 396 297 (44) 1988 $2,048 2,245 941 381 389 261 (13) Fixed Asset Expenditures 1990 1989 1988 $ 234 $ 216 $182 548 536 435 223 182 98 47 36 39 31 32 28 44 43 41 - - -. Depreciation 1990 1989 1988 8159 $124 $ 93 345 306 253 101 55 52 35 36 30 31 29 30 19 17 18 --- Industry totals General corporate 8,003 739 7,129 557 6,252 458 1,127 1,045 823 133 79 76 690 567 476 50 36 26 Consolidated totals 88,742 $7,686 $6,710 81,260 Expenditures and depreciation do not include amountsfor equipment leased to others. $1,124 $899 $740 $603 $502 34
-
 1
1 -
2
-
3
-
4
-
5
-
6
-
7
-
8
-
9
-
10
-
11
-
12
-
13
-
14
-
15
-
16
-
17
-
18
-
19
-
20
-
21
-
22
-
23
-
24
-
25
-
26
-
27
-
28
-
29
-
30
-
 31
31 -
 32
32 -
 33
33 -
 34
34 -
 35
35 -
 36
36 -
 37
37 -
 38
38 -
 39
39 -
 40
40 -
 41
41 -
42
-
43
-
44
 |
 |
