Texas Instruments TI-34 User Manual - Page 34
Statistics - how to use 34
 |
UPC - 331719036203
View all Texas Instruments TI-34 manuals
Add to My Manuals
Save this manual to your list of manuals |
Page 34 highlights
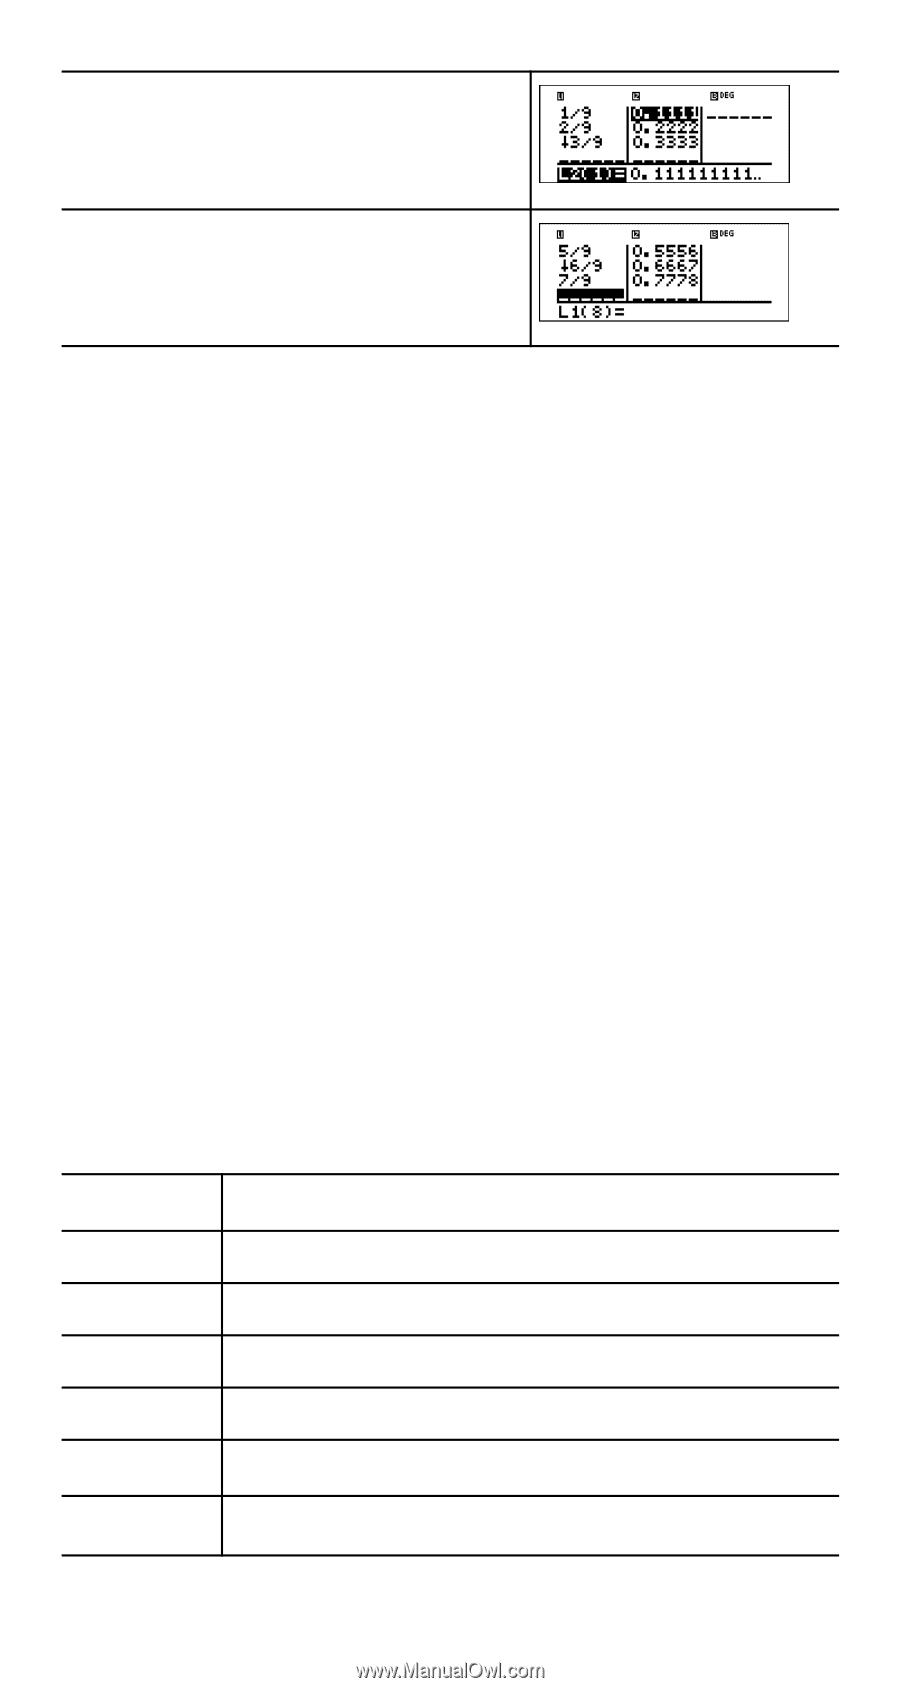
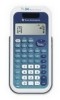
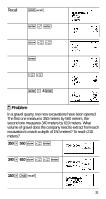
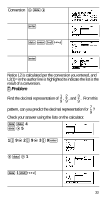
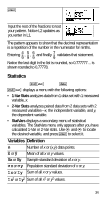
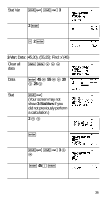
< Input the rest of the fractions to test your pattern. Notice L2 updates as you enter in L1. The pattern appears to show that the decimal representation is a repetition of the number in the numerator for ninths. Entering 4-- , 5-- , 6-- and finally 7-- validates that statement. 999 9 Notice the last digit in the list is rounded, so 0.777777... is shown rounded to 0.77778. Statistics %t v %t displays a menu with the following options: • 1-Var Stats analyzes data from 1 data set with 1 measured variable, x. • 2-Var Stats analyzes paired data from 2 data sets with 2 measured variables-x, the independent variable, and y, the dependent variable. • StatVars displays a secondary menu of statistical variables. The StatVars menu only appears after you have calculated 1-Var or 2-Var stats. Use $ and # to locate the desired variable, and press < to select it. Variables Definition n Number of x or (x,y) data points. Ï or Ð Mean of all x or y values. Sx or Sy Sample standard deviation of x or y. Îx or Îy Population standard deviation of x or y. Σx or Σy Sum of all x or y values. Σx2 or Σy2 Sum of all x2 or y2 values. 34
-
 1
1 -
2
-
3
-
4
-
5
-
6
-
7
-
8
-
9
-
10
-
11
-
12
-
13
-
14
-
15
-
16
-
17
-
18
-
19
-
20
-
21
-
22
-
23
-
24
-
25
-
26
-
27
-
28
-
 29
29 -
 30
30 -
 31
31 -
 32
32 -
 33
33 -
 34
34 -
 35
35 -
 36
36 -
 37
37 -
 38
38 -
 39
39 -
40
-
41
-
42
-
43
-
44
-
45
 |
 |