ZyXEL PLA450 v2 User Guide - Page 44
Introducing the Web Configurator, PLA450 User's Guide, Summary: My Homeplug Network
 |
View all ZyXEL PLA450 v2 manuals
Add to My Manuals
Save this manual to your list of manuals |
Page 44 highlights
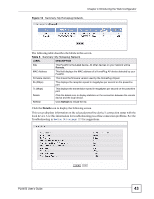
Chapter 4 Introducing the Web Configurator The following table describes the labels in this screen. Table 9 Summary: My Homeplug Network LABEL DESCRIPTION Statistics MAC Address This field displays the MAC address of the powerline device detected by your PLA450. Rx PHY Rate This field shows the transfer rate of data received by the local device from the selected remote device, measured in Mbps. Tx PHY Rate This field shows the transfer rate of data sent the local device to the selected powerline device, measured in Mbps. Avg. Pre-FEC Bit Error Rate In powerline networks data is sent in physical blocks (PB). This field shows the average percentage of errors in the physical blocks sent by the destination device to your local device before the errors are corrected using FEC (Forward Error Correction). A high error rate may not necessarily result in a poor connection as PBs with errors are discarded and the powerline device adjusts the signal to a frequency to a level where fewer errors occur Avg. Source PB CRC Error Rate This field displays the average CRC (Cyclic Redundancy Check) error rate of transmission from the destination device to the local device. The CRC error check is performed after Forward Error Correction. If the error rate after FEC error correction is still high, then this indicates a lot of noise at all frequencies on this section of your powerline. Data transmission rates are reduced if there is a lot of noise on the line. Avg. Dest PB CRC Error Rate This field displays the average CRC (Cyclic Redundancy Check) error rate of transmission sent from the local device to the selected powerline device. The CRC error check is performed after Forward Error Correction. If the error rate after FEC error correction is still high, then this indicates a lot of noise at all frequencies on this section of your powerline. Data transmission rates are reduced if there is a lot of noise on the line. Avg. Bits This field displays the average number of bits transferred over the connection measured in Mbps. This represents the physical rate of data transmission (the PHY rate) which includes not only the files sent on your powerline, but also line overhead required to manage your network, such as error correction bits. The PHY rate is the clearest indicator of the quality of your line. • If the PHY rate is close to the HomePlug AV maximum data transfer rate (see Chapter 15 on page 123), then the quality of this section of the line is very high, with very little attenuation. (See Avg. Attenuation for details on attenuation). • If the PHY rate varies between the maximum level and a lower level (such as 60 Mbps), there is noise on this section of your powerline. Attenuation is not a factor. If the PHY rate is steady at a lower level (such as 80 Mbps), this is caused by attenuation and not noise on this section of your powerline Avg. SNR This field displays the average SNR (Signal to Noise Ratio) measured in dB. Use this to check the amount of noise on this part of your powerline network. The higher the number the better the connection quality. Noise on your powerline is usually caused by household appliances running on your powerline. The motor of a refrigerator can create electrical interference. A cell/mobile phone recharger which rapidly alternates between on and off can also generate noise. Poor cable quality and installation can also cause noise. To identify causes of noise on your network, disconnect an appliance connected on this part of your powerline network and observe whether this reduces the Signalto-Noise ratio. 44 PLA450 User's Guide
-
 1
1 -
2
-
3
-
4
-
5
-
6
-
7
-
8
-
9
-
10
-
11
-
12
-
13
-
14
-
15
-
16
-
17
-
18
-
19
-
20
-
21
-
22
-
23
-
24
-
25
-
26
-
27
-
28
-
29
-
30
-
31
-
32
-
33
-
34
-
35
-
36
-
37
-
38
-
 39
39 -
 40
40 -
 41
41 -
 42
42 -
 43
43 -
 44
44 -
 45
45 -
 46
46 -
 47
47 -
 48
48 -
 49
49 -
50
-
51
-
52
-
53
-
54
-
55
-
56
-
57
-
58
-
59
-
60
-
61
-
62
-
63
-
64
-
65
-
66
-
67
-
68
-
69
-
70
-
71
-
72
-
73
-
74
-
75
-
76
-
77
-
78
-
79
-
80
-
81
-
82
-
83
-
84
-
85
-
86
-
87
-
88
-
89
-
90
-
91
-
92
-
93
-
94
-
95
-
96
-
97
-
98
-
99
-
100
-
101
-
102
-
103
-
104
-
105
-
106
-
107
-
108
-
109
-
110
-
111
-
112
-
113
-
114
-
115
-
116
-
117
-
118
-
119
-
120
-
121
-
122
-
123
-
124
-
125
-
126
-
127
-
128
-
129
-
130
-
131
-
132
-
133
-
134
-
135
-
136
-
137
-
138
-
139
-
140
-
141
-
142
-
143
-
144
-
145
-
146
-
147
-
148
-
149
-
150
-
151
-
152
-
153
-
154
-
155
-
156
-
157
-
158
-
159
-
160
-
161
-
162
-
163
-
164
-
165
-
166
-
167
-
168
-
169
-
170
-
171
-
172
-
173
-
174
-
175
-
176
-
177
-
178
-
179
-
180
-
181
-
182
-
183
-
184
-
185
-
186
-
187
-
188
-
189
-
190
 |
 |