Cisco CISCO1005-CH Deployment Guide - Page 23
Average 802.11a Client Throughput versus Cisco 1000 Series Lightweight Access
 |
UPC - 746320013343
View all Cisco CISCO1005-CH manuals
Add to My Manuals
Save this manual to your list of manuals |
Page 23 highlights
Deployment Determining Deployment Requirements Figure 1 Average Client Throughput versus Signal Strength The following figures show the relationship between average client performance and Cisco 1000 series lightweight access point density for 802.11a and 802.11b clients. The typical Cisco 1000 series lightweight access point density for most enterprise buildings deployed for full coverage is between 2500 and 7000 square feet per Cisco 1000 series lightweight access point. Figure 2 Average 802.11a Client Throughput versus Cisco 1000 Series Lightweight Access Point Density for Typical Office Spaces 78-17279-01 Deployment Guide: Cisco Aironet 1000 Series Lightweight Access Points 5
-
 1
1 -
2
-
3
-
4
-
5
-
6
-
7
-
8
-
9
-
10
-
11
-
12
-
13
-
14
-
15
-
16
-
17
-
 18
18 -
 19
19 -
 20
20 -
 21
21 -
 22
22 -
 23
23 -
 24
24 -
 25
25 -
 26
26 -
 27
27 -
 28
28 -
29
-
30
-
31
-
32
-
33
-
34
-
35
-
36
-
37
-
38
-
39
-
40
 |
 |

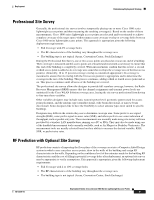
Deployment
Determining Deployment Requirements
5
Deployment Guide: Cisco Aironet 1000 Series Lightweight Access Points
78-17279-01
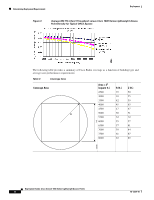
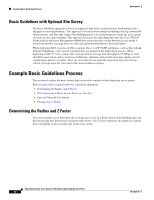
Figure 1
Average Client Throughput versus Signal Strength
The following figures show the relationship between average client performance and Cisco 1000 series
lightweight access point density for 802.11a and 802.11b clients. The typical Cisco 1000 series
lightweight access point density for most enterprise buildings deployed for full coverage is between
2500 and 7000 square feet per Cisco 1000 series lightweight access point.
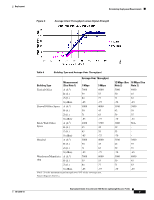
Figure 2
Average 802.11a Client Throughput versus Cisco 1000 Series Lightweight Access
Point Density for Typical Office Spaces