Cisco CISCO1005-CH Deployment Guide - Page 29
Table 6, Radius and Z Factor Table, The following graph displays actual measurements
 |
UPC - 746320013343
View all Cisco CISCO1005-CH manuals
Add to My Manuals
Save this manual to your list of manuals |
Page 29 highlights
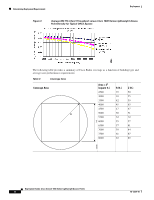
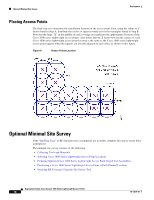
Deployment Table 6 Radius and Z Factor Table Coverage Area R Example Basic Guidelines Process Area = Z2 (square ft.) 2500 3000 3500 4000 4500 5000 5500 Z 6000 6500 7000 7500 8000 R (ft.) 35 39 42 45 47 50 52 55 57 59 61 63 Z (ft.) 50 55 59 63 67 71 72 57 81 84 87 89 135685 The following graph displays actual measurements, and shows the relationship between actual user throughput and corresponding signal strength. 78-17279-01 Deployment Guide: Cisco Aironet 1000 Series Lightweight Access Points 11
-
 1
1 -
2
-
3
-
4
-
5
-
6
-
7
-
8
-
9
-
10
-
11
-
12
-
13
-
14
-
15
-
16
-
17
-
18
-
19
-
20
-
21
-
22
-
23
-
 24
24 -
 25
25 -
 26
26 -
 27
27 -
 28
28 -
 29
29 -
 30
30 -
 31
31 -
 32
32 -
 33
33 -
 34
34 -
35
-
36
-
37
-
38
-
39
-
40
 |
 |

Deployment
Example Basic Guidelines Process
11
Deployment Guide: Cisco Aironet 1000 Series Lightweight Access Points
78-17279-01
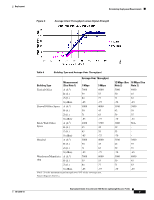
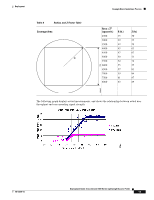
The following graph displays actual measurements, and shows the relationship between actual user
throughput and corresponding signal strength.
Table 6
Radius and Z Factor Table
Coverage Area
Area = Z
2
(square ft.)
R (ft.)
Z (ft.)
2500
35
50
3000
39
55
3500
42
59
4000
45
63
4500
47
67
5000
50
71
5500
52
72
6000
55
57
6500
57
81
7000
59
84
7500
61
87
8000
63
89
R
Z
135685