Garmin Fishfinder 400C Owner's Manual - Page 25
Understanding the Numbers Screen, Numbers, SELECT, Temp Log
 |
UPC - 753759063801
View all Garmin Fishfinder 400C manuals
Add to My Manuals
Save this manual to your list of manuals |
Page 25 highlights
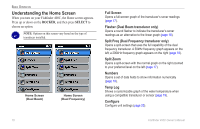
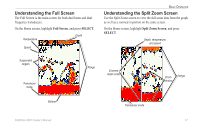
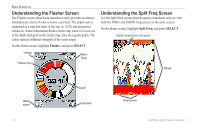
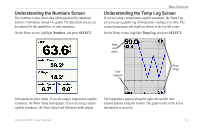
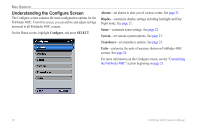
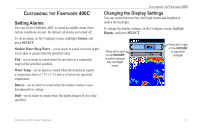
Understanding the Numbers Screen The Numbers screen shows data fields populated by important numeric information instead of a graph. The data fields you see are determined by the capabilities of your transducer. On the Home screen, highlight Numbers, and press SELECT. Basic Operation Understanding the Temp Log Screen If you are using a temperature-capable transducer, the Temp Log screen keeps a graphic log of temperature readings over time. The current temperature and depth are shown in the top left corner. On the Home screen, highlight Temp Log, and press SELECT. Temp and depth Time elapsed Temp range All transducers show depth. If you are using a temperature-capable transducer, the Water Temp field appears. If you are using a speedcapable transducer, the Water Speed and Odometer fields appear. The temperature appears along the right side and the time elapsed appears along the bottom. The graph scrolls to the left as information is received. Fishfinder 400C Owner's Manual 19
-
 1
1 -
2
-
3
-
4
-
5
-
6
-
7
-
8
-
9
-
10
-
11
-
12
-
13
-
14
-
15
-
16
-
17
-
18
-
19
-
 20
20 -
 21
21 -
 22
22 -
 23
23 -
 24
24 -
 25
25 -
 26
26 -
 27
27 -
 28
28 -
 29
29 -
 30
30 -
31
-
32
-
33
-
34
-
35
-
36
-
37
-
38
-
39
-
40
 |
 |
