HP 39g hp 39g & 40g_user's manual_English_E_pdfbpia5212.pdf - Page 104
Fit models, To define your, own fit
 |
View all HP 39g manuals
Add to My Manuals
Save this manual to your list of manuals |
Page 104 highlights
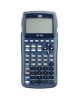
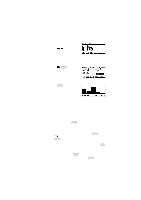
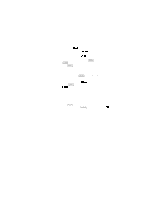
Fit models Eight fit models are available: Fit model Meaning Linear (Default.) Fits the data to a straight line, y = mx+b. Uses a least-squares fit. Logarithmic Exponential Power Fits to a logarithmic curve, y = m lnx + b. Fits to an exponential curve, y = bemx. Fits to a power curve, y = bxm. Quadratic Fits to a quadratic curve, y = ax2+bx+c. Needs at least three points. Cubic Fits to a cubic curve, y = ax3+bx2+cx+d. Needs at least four points. Logistic Fits to a logistic curve, y = ------------L 1 + ae(-bx) , where L is the saturation value for growth. You can store a positive real value in L, or-if L=0-let L be computed automatically. User Defined Define your own expression (in Symbolic view.) To define your own fit 1. In Numeric view, make sure is set. 2. Display the Symbolic view. 3. Highlight the Fit expression (Fit1, etc.) for the desired data set. 4. Type in an expression and press . The independent variable must be X, and the expression must not contain any unknown variables. Example: 1.5 × cos x + 0.3 × sin x . This automatically changes the Fit type (S1FIT, etc.) in the Symbolic Setup view to User Defined. 8-12 Statistics aplet
-
 1
1 -
2
-
3
-
4
-
5
-
6
-
7
-
8
-
9
-
10
-
11
-
12
-
13
-
14
-
15
-
16
-
17
-
18
-
19
-
20
-
21
-
22
-
23
-
24
-
25
-
26
-
27
-
28
-
29
-
30
-
31
-
32
-
33
-
34
-
35
-
36
-
37
-
38
-
39
-
40
-
41
-
42
-
43
-
44
-
45
-
46
-
47
-
48
-
49
-
50
-
51
-
52
-
53
-
54
-
55
-
56
-
57
-
58
-
59
-
60
-
61
-
62
-
63
-
64
-
65
-
66
-
67
-
68
-
69
-
70
-
71
-
72
-
73
-
74
-
75
-
76
-
77
-
78
-
79
-
80
-
81
-
82
-
83
-
84
-
85
-
86
-
87
-
88
-
89
-
90
-
91
-
92
-
93
-
94
-
95
-
96
-
97
-
98
-
 99
99 -
 100
100 -
 101
101 -
 102
102 -
 103
103 -
 104
104 -
 105
105 -
 106
106 -
 107
107 -
 108
108 -
 109
109 -
110
-
111
-
112
-
113
-
114
-
115
-
116
-
117
-
118
-
119
-
120
-
121
-
122
-
123
-
124
-
125
-
126
-
127
-
128
-
129
-
130
-
131
-
132
-
133
-
134
-
135
-
136
-
137
-
138
-
139
-
140
-
141
-
142
-
143
-
144
-
145
-
146
-
147
-
148
-
149
-
150
-
151
-
152
-
153
-
154
-
155
-
156
-
157
-
158
-
159
-
160
-
161
-
162
-
163
-
164
-
165
-
166
-
167
-
168
-
169
-
170
-
171
-
172
-
173
-
174
-
175
-
176
-
177
-
178
-
179
-
180
-
181
-
182
-
183
-
184
-
185
-
186
-
187
-
188
-
189
-
190
-
191
-
192
-
193
-
194
-
195
-
196
-
197
-
198
-
199
-
200
-
201
-
202
-
203
-
204
-
205
-
206
-
207
-
208
-
209
-
210
-
211
-
212
-
213
-
214
-
215
-
216
-
217
-
218
-
219
-
220
-
221
-
222
-
223
-
224
-
225
-
226
-
227
-
228
-
229
-
230
-
231
-
232
-
233
-
234
-
235
-
236
-
237
-
238
-
239
-
240
-
241
-
242
-
243
-
244
-
245
-
246
-
247
-
248
-
249
-
250
-
251
-
252
-
253
-
254
-
255
-
256
-
257
-
258
-
259
-
260
-
261
-
262
-
263
-
264
-
265
-
266
-
267
-
268
-
269
-
270
-
271
-
272
-
273
-
274
-
275
-
276
-
277
-
278
-
279
-
280
-
281
-
282
-
283
-
284
-
285
-
286
-
287
-
288
 |
 |