HP 39g hp 39g & 40g_user's manual_English_E_pdfbpia5212.pdf - Page 24
Trig Explorer, aplet
 |
View all HP 39g manuals
Add to My Manuals
Save this manual to your list of manuals |
Page 24 highlights
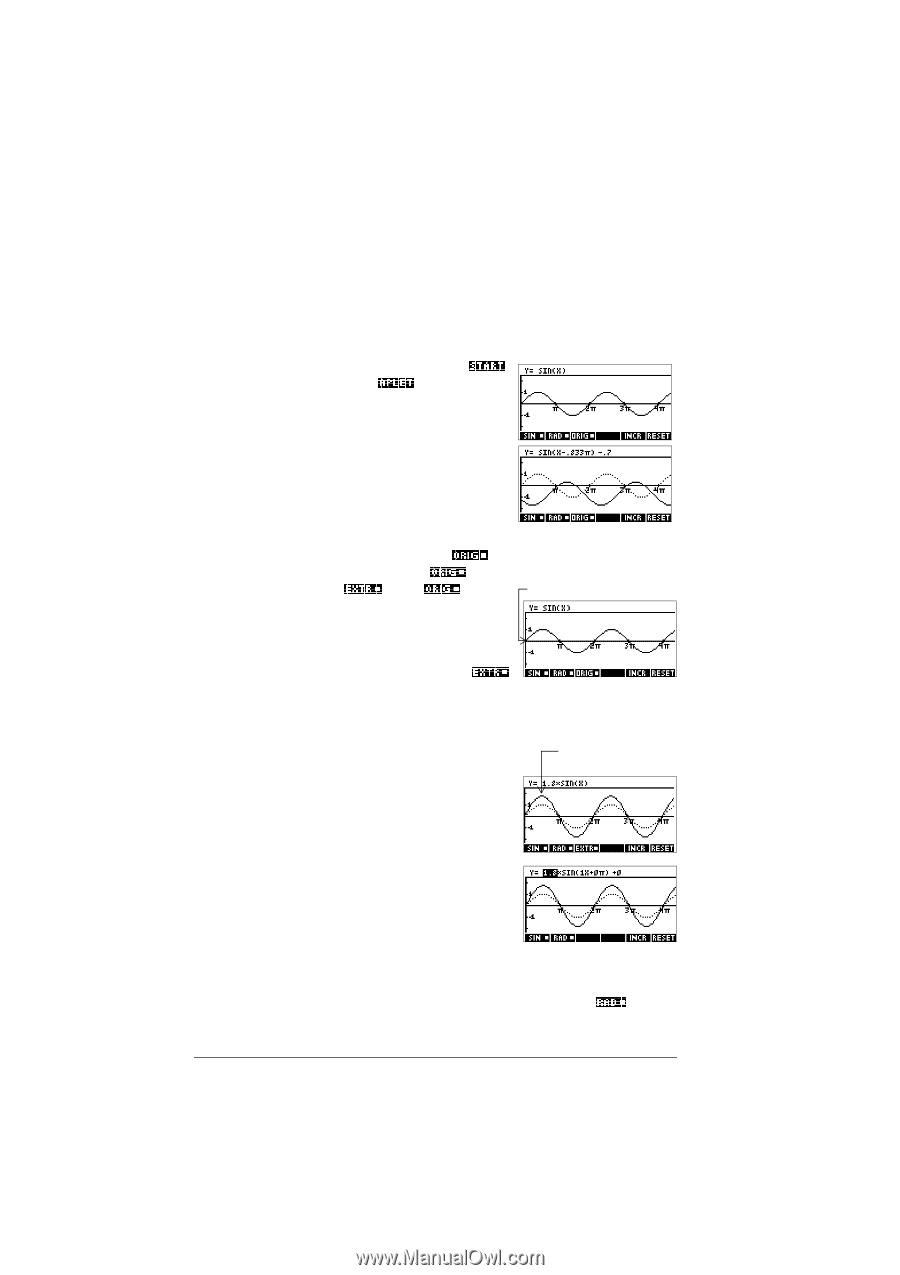
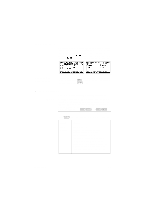
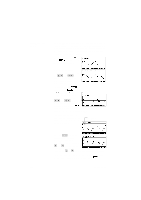
Trig Explorer aplet The Trig Explorer aplet is used to investigate the behaviour of the graph of y = a sin (bx + c) + d as the values of a, b, c and d change, both by manipulating the equation and seeing the change in the graph, or by manipulating the graph and seeing the change in the equation. When the user presses in the view, the screen shown right is displayed. In this mode, the graph controls the equation. Pressing the and keys transforms the graph, with these transformations reflected in the equation. The button labelled is a toggle between and . When is Origin chosen, the 'point of control' is at the origin (0,0) and the and keys control vertical and horizontal transformations. When is chosen the 'point of control' is on the first extremum of the graph (i.e. for the sine graph at (π ⁄ 2,1) . The arrow keys change the amplitude and frequency of the graph. This is most easily seen by experimenting. Extremum Pressing displays the equation at the top of the screen. The equation is controls the graph. Pressing the and keys moves from parameter to parameter. Pressing the or key changes the parameter's values. The default angle setting for this aplet is radians. The angle setting can be changed to degrees by pressing . 1-14 Getting started
-
 1
1 -
2
-
3
-
4
-
5
-
6
-
7
-
8
-
9
-
10
-
11
-
12
-
13
-
14
-
15
-
16
-
17
-
18
-
 19
19 -
 20
20 -
 21
21 -
 22
22 -
 23
23 -
 24
24 -
 25
25 -
 26
26 -
 27
27 -
 28
28 -
 29
29 -
30
-
31
-
32
-
33
-
34
-
35
-
36
-
37
-
38
-
39
-
40
-
41
-
42
-
43
-
44
-
45
-
46
-
47
-
48
-
49
-
50
-
51
-
52
-
53
-
54
-
55
-
56
-
57
-
58
-
59
-
60
-
61
-
62
-
63
-
64
-
65
-
66
-
67
-
68
-
69
-
70
-
71
-
72
-
73
-
74
-
75
-
76
-
77
-
78
-
79
-
80
-
81
-
82
-
83
-
84
-
85
-
86
-
87
-
88
-
89
-
90
-
91
-
92
-
93
-
94
-
95
-
96
-
97
-
98
-
99
-
100
-
101
-
102
-
103
-
104
-
105
-
106
-
107
-
108
-
109
-
110
-
111
-
112
-
113
-
114
-
115
-
116
-
117
-
118
-
119
-
120
-
121
-
122
-
123
-
124
-
125
-
126
-
127
-
128
-
129
-
130
-
131
-
132
-
133
-
134
-
135
-
136
-
137
-
138
-
139
-
140
-
141
-
142
-
143
-
144
-
145
-
146
-
147
-
148
-
149
-
150
-
151
-
152
-
153
-
154
-
155
-
156
-
157
-
158
-
159
-
160
-
161
-
162
-
163
-
164
-
165
-
166
-
167
-
168
-
169
-
170
-
171
-
172
-
173
-
174
-
175
-
176
-
177
-
178
-
179
-
180
-
181
-
182
-
183
-
184
-
185
-
186
-
187
-
188
-
189
-
190
-
191
-
192
-
193
-
194
-
195
-
196
-
197
-
198
-
199
-
200
-
201
-
202
-
203
-
204
-
205
-
206
-
207
-
208
-
209
-
210
-
211
-
212
-
213
-
214
-
215
-
216
-
217
-
218
-
219
-
220
-
221
-
222
-
223
-
224
-
225
-
226
-
227
-
228
-
229
-
230
-
231
-
232
-
233
-
234
-
235
-
236
-
237
-
238
-
239
-
240
-
241
-
242
-
243
-
244
-
245
-
246
-
247
-
248
-
249
-
250
-
251
-
252
-
253
-
254
-
255
-
256
-
257
-
258
-
259
-
260
-
261
-
262
-
263
-
264
-
265
-
266
-
267
-
268
-
269
-
270
-
271
-
272
-
273
-
274
-
275
-
276
-
277
-
278
-
279
-
280
-
281
-
282
-
283
-
284
-
285
-
286
-
287
-
288
 |
 |