HP Brocade BladeSystem 4/24 HP StorageWorks Fabric OS 6.1.1 administrator guid - Page 352
Deleting the fabric mode Top Talker monitors
 |
View all HP Brocade BladeSystem 4/24 manuals
Add to My Manuals
Save this manual to your list of manuals |
Page 352 highlights
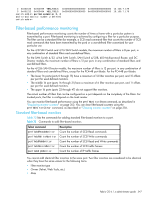
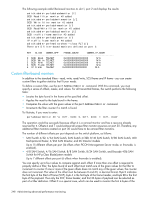
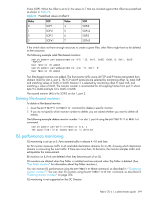
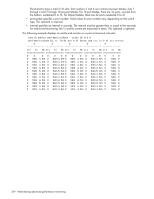
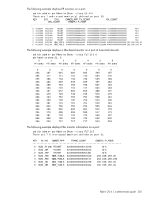
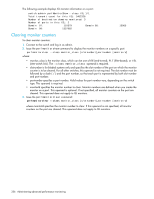
Use the perfttmon command to add, delete, and display Top Talker monitors. Adding Top Talker monitors on all switches in the fabric To add Top Talker monitors on all switches in the fabric: 1. Connect to the switch and log in as admin. 2. Remove any end-to-end monitors in the fabric, as described in "Deleting end-to-end monitors" on page 346. Fabric Mode Top Talker monitors and end-to-end monitors cannot both exist in the fabric. 3. Issue the perfttmon --add fabricmode command: perfttmon --add fabricmode The system responds: Before enabling fabric mode, please remove all EE monitors in the fabric continue? (yes, y, no, n): 4. Enter y at the prompt to continue. Top Talker monitors are added to all E_Ports in the fabric and fabric mode is enabled. Any Top Talker monitors that were already installed on F_Ports are automatically uninstalled. If end-to-end monitors are present on the local switch, the command fails with the message: Cannot install Fabric Mode Top Talker because EE monitor is already present. If end-to-end monitors are present on remote switches running Fabric OS 6.1.0 or later, the command succeeds. On the remote switches, however, fabric mode fails and a raslog message is displayed on those switches. If end-to-end monitors are present on remote switches running Fabric OS 6.0.x, the command succeeds. If a new switch joins the fabric, you must run the perfttmon --add fabricmode command on the new switch. The Top Talker configuration information is not automatically propagated to the new switch. Deleting the fabric mode Top Talker monitors To delete the fabric mode Top Talker monitors: 1. Connect to the switch and log in as admin. 2. Issue the perfttmon --delete fabricmode command: perfttmon --delete fabricmode All Top Talker monitors are deleted. Displaying top talking flows on the switch for a given Domain ID To display top talking flows on the switch for a given Domain ID: 1. Connect to the switch and log in as admin. 2. Issue the perfttmon --show dom command: perfttmon --show dom domainid [n] [wwn | pid] where: • domainind is the Domain ID of the switch • n is the number of top talking flows to display (between 1 and 32) • wwn | pid is the format of the output (the default is wwn Fabric mode must be enabled for this option. The output is sorted based on the data rate of each flow. If you do not specify the number of flows to display, the command displays the top 8 flows or the total number of flows, whichever is less. The command can display a maximum of 32 flows. For example, to display the top 5 flows on for domain 1 in WWN (default) format: perfttmon --show dom 1 5 352 Administering advanced performance monitoring
-
 1
1 -
2
-
3
-
4
-
5
-
6
-
7
-
8
-
9
-
10
-
11
-
12
-
13
-
14
-
15
-
16
-
17
-
18
-
19
-
20
-
21
-
22
-
23
-
24
-
25
-
26
-
27
-
28
-
29
-
30
-
31
-
32
-
33
-
34
-
35
-
36
-
37
-
38
-
39
-
40
-
41
-
42
-
43
-
44
-
45
-
46
-
47
-
48
-
49
-
50
-
51
-
52
-
53
-
54
-
55
-
56
-
57
-
58
-
59
-
60
-
61
-
62
-
63
-
64
-
65
-
66
-
67
-
68
-
69
-
70
-
71
-
72
-
73
-
74
-
75
-
76
-
77
-
78
-
79
-
80
-
81
-
82
-
83
-
84
-
85
-
86
-
87
-
88
-
89
-
90
-
91
-
92
-
93
-
94
-
95
-
96
-
97
-
98
-
99
-
100
-
101
-
102
-
103
-
104
-
105
-
106
-
107
-
108
-
109
-
110
-
111
-
112
-
113
-
114
-
115
-
116
-
117
-
118
-
119
-
120
-
121
-
122
-
123
-
124
-
125
-
126
-
127
-
128
-
129
-
130
-
131
-
132
-
133
-
134
-
135
-
136
-
137
-
138
-
139
-
140
-
141
-
142
-
143
-
144
-
145
-
146
-
147
-
148
-
149
-
150
-
151
-
152
-
153
-
154
-
155
-
156
-
157
-
158
-
159
-
160
-
161
-
162
-
163
-
164
-
165
-
166
-
167
-
168
-
169
-
170
-
171
-
172
-
173
-
174
-
175
-
176
-
177
-
178
-
179
-
180
-
181
-
182
-
183
-
184
-
185
-
186
-
187
-
188
-
189
-
190
-
191
-
192
-
193
-
194
-
195
-
196
-
197
-
198
-
199
-
200
-
201
-
202
-
203
-
204
-
205
-
206
-
207
-
208
-
209
-
210
-
211
-
212
-
213
-
214
-
215
-
216
-
217
-
218
-
219
-
220
-
221
-
222
-
223
-
224
-
225
-
226
-
227
-
228
-
229
-
230
-
231
-
232
-
233
-
234
-
235
-
236
-
237
-
238
-
239
-
240
-
241
-
242
-
243
-
244
-
245
-
246
-
247
-
248
-
249
-
250
-
251
-
252
-
253
-
254
-
255
-
256
-
257
-
258
-
259
-
260
-
261
-
262
-
263
-
264
-
265
-
266
-
267
-
268
-
269
-
270
-
271
-
272
-
273
-
274
-
275
-
276
-
277
-
278
-
279
-
280
-
281
-
282
-
283
-
284
-
285
-
286
-
287
-
288
-
289
-
290
-
291
-
292
-
293
-
294
-
295
-
296
-
297
-
298
-
299
-
300
-
301
-
302
-
303
-
304
-
305
-
306
-
307
-
308
-
309
-
310
-
311
-
312
-
313
-
314
-
315
-
316
-
317
-
318
-
319
-
320
-
321
-
322
-
323
-
324
-
325
-
326
-
327
-
328
-
329
-
330
-
331
-
332
-
333
-
334
-
335
-
336
-
337
-
338
-
339
-
340
-
341
-
342
-
343
-
344
-
345
-
346
-
 347
347 -
 348
348 -
 349
349 -
 350
350 -
 351
351 -
 352
352 -
 353
353 -
 354
354 -
 355
355 -
 356
356 -
 357
357 -
358
-
359
-
360
-
361
-
362
-
363
-
364
-
365
-
366
-
367
-
368
-
369
-
370
-
371
-
372
-
373
-
374
-
375
-
376
-
377
-
378
-
379
-
380
-
381
-
382
-
383
-
384
-
385
-
386
-
387
-
388
-
389
-
390
-
391
-
392
-
393
-
394
-
395
-
396
-
397
-
398
-
399
-
400
-
401
-
402
-
403
-
404
-
405
-
406
-
407
-
408
-
409
-
410
-
411
-
412
-
413
-
414
-
415
-
416
-
417
-
418
-
419
-
420
-
421
-
422
-
423
-
424
-
425
-
426
-
427
-
428
-
429
-
430
-
431
-
432
-
433
-
434
-
435
-
436
-
437
-
438
-
439
-
440
-
441
-
442
-
443
-
444
-
445
-
446
-
447
-
448
-
449
-
450
-
451
-
452
-
453
-
454
-
455
-
456
-
457
-
458
-
459
-
460
-
461
-
462
-
463
-
464
-
465
-
466
-
467
-
468
-
469
-
470
-
471
-
472
-
473
-
474
-
475
-
476
-
477
-
478
-
479
-
480
-
481
-
482
-
483
-
484
-
485
-
486
-
487
-
488
-
489
-
490
-
491
-
492
-
493
-
494
-
495
-
496
 |
 |