Motorola 8167 User Manual - Page 27
Liquidity, Capital, Resources
 |
View all Motorola 8167 manuals
Add to My Manuals
Save this manual to your list of manuals |
Page 27 highlights
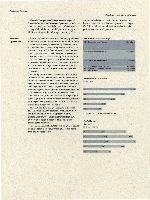
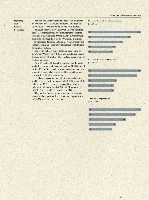
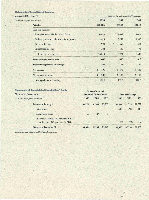
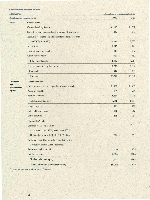
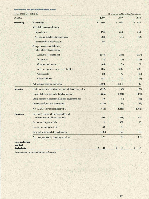
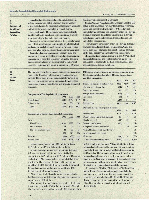
Liquidity and Capital Resources * Motorola, Inc. and Consolidated Subsidiaries Net cash provided by operations showed an 8% increase in 1990 totalling $1.31 billion, up from $1.21 billion in 1989. In 1988, operating cash flow was $725 million. Although receivable levels grew at a slower pace than sales, accounts receivable weeks outstanding remained constant at 8.0 weeks for 1990 and 1989. Inventory turns improved only slightly to 3.7 in 1990 from 3.6 in 1989. The temporary flattening in these asset employment indicators presents an opportunity to improve contributions to cash flow in 1991. Motorola's net debt to net debt plus equity ratio of 23.7% for 1990 is even with 1989 and maintains a strong balance sheet with a ratio within the Company's financial policy guidelines. As of December 31,1990, the Company has domestic and international credit facilities totalling $1.78 billion, of which $788 million remain unused. Cash generated from operations and available credit facilities provide support for near term funding requirements. Fixed asset expenditures required to support current and long-term growth increased to $1.26 billion from $1.12 billion in 1989. The Company's expenditure level in relation to sales continued at 12% in 1990, consistent with 1989 and up slightly from 11% in 1988. The Semiconductor Products segment continues to comprise the largest portion of fixed asset expenditures, with 43% of all such investments. Research & Development Expenditures (In millions) Net Cash Provided by Operations (In millions) ,662 Fixed Asset Expenditures (In millions) 1.308 1,211 1.124 658 25
-
 1
1 -
2
-
3
-
4
-
5
-
6
-
7
-
8
-
9
-
10
-
11
-
12
-
13
-
14
-
15
-
16
-
17
-
18
-
19
-
20
-
21
-
 22
22 -
 23
23 -
 24
24 -
 25
25 -
 26
26 -
 27
27 -
 28
28 -
 29
29 -
 30
30 -
 31
31 -
 32
32 -
33
-
34
-
35
-
36
-
37
-
38
-
39
-
40
-
41
-
42
-
43
-
44
 |
 |
