Motorola 8167 User Manual - Page 38
Five Year Financial Summary, Quarterly and Other Financial Data
 |
View all Motorola 8167 manuals
Add to My Manuals
Save this manual to your list of manuals |
Page 38 highlights
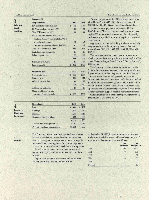
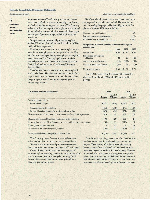
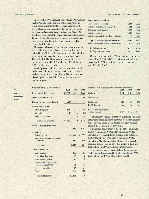
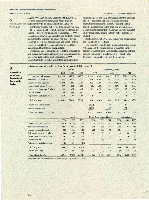
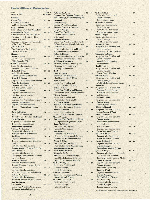
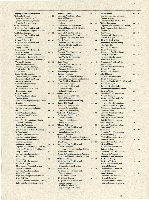
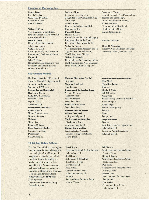
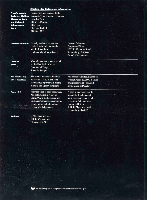
Five Year Financial Summary Years ended December 31 (In millions, except as noted) Operating Results Net sales Manufacturing and other costs of sales Selling, general and administrative expenses Depreciation expense Interest expense, net Total costs and expenses Earnings before income taxes Income taxes provided on earnings Net earnings Net earnings as a percent of sales Per Share Data (In dollars) Net earnings Dividends declared Total assets Working capital Long-term debt Total debt Total stockholders' equity Other Data Current ratio Return on average invested capital Return on average stockholders' equity Year-end employment (in thousands) Average shares outstanding 1990 Motorola, Inc. and Consolidated Subsidiaries 1989 1988 1987 1986 810,885 $9,620 $8,250 $6,727 $5,905 6,882 5,905 5,040 4,071 3,656 2,414 2,289 1,957 1,665 1,437 790 650 543 494 459 133 130 98 79 86 10,219 8,974 7,638 6,309 5,638 666 646 612 418 267 167 148 167 110 73 * 499 $ 498 $ 445 $ 308 $ 194 4.6% 5.2% 5.4% 4.6% 3.3% $ 3.80 $ 3.83 $ 3.43 $ 2.39 $ 1.53 .76 .76 .67 .64 .64 $ 8,742 1,404 792 $7,686 1,261 755 $6,710 758 343 $5,517 932 344 $4,826 803 334 1,787 1,542 1,381 917 786 $ 4,257 $3,803 $3,375 $3,008 $2,754 1.46 1.48 1.29 1.52 1.54 9.4% 10.3% 11.0% 8.8% 5.9% 12.3% 13.9% 13.9% 10.7% 7.4% 105.0 104.0 102.0 97.7 94.4 131.3 130.0 129.6 128.9 126.5 Quarterly and Other Financial Data (In millions, except per share amounts) (Unaudited) 1990Quarte« 1st 2nd 3rd 4th Net sales 82,533 $2,715 $2,703 $2,934 Gross profit 904 1,024 980 1,095 Net earnings 127 161 102 109 Net earnings per share .98 1.22 .78 .82 Dividends declared and paid .19 .19 .19 .19 Stock prices: High 69.88 88.13 88.13 66.50 Low 54.50 64.13 59.13 49.88 The number of holders of record ofMotorola Common Stock on January 31,1991 was 15,020. 1989 Quarters 1st 2nd 3rd 4th $2,175 $2,385 $2,408 $2,652 842 960 886 1,027 123 154 89 132 .95 1.18 .69 1.01 .19 .19 .19 .19 47.63 39.50 60.38 41.13 62.00 51.00 61.75 53.00 36
-
 1
1 -
2
-
3
-
4
-
5
-
6
-
7
-
8
-
9
-
10
-
11
-
12
-
13
-
14
-
15
-
16
-
17
-
18
-
19
-
20
-
21
-
22
-
23
-
24
-
25
-
26
-
27
-
28
-
29
-
30
-
31
-
32
-
 33
33 -
 34
34 -
 35
35 -
 36
36 -
 37
37 -
 38
38 -
 39
39 -
 40
40 -
 41
41 -
 42
42 -
 43
43 -
44
 |
 |
