Netgear DGND3800B DGND3800B User Manual (PDF) - Page 61
Show Statistics Button, ADSL Link Downstream or Upstream
 |
View all Netgear DGND3800B manuals
Add to My Manuals
Save this manual to your list of manuals |
Page 61 highlights
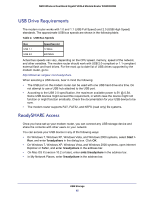
N600 Wireless Dual Band Gigabit VDSL2 Modem Router DGND3800B Show Statistics Button Click the Show Statistics button on the Router Status screen to display a screen similar to this: Figure 10. Router statistics screen • Port. The statistics for the WAN (Internet), LAN (local), and wireless LAN (WLAN) ports. For each port, the screen displays the following: - Status. The link status of the port. - TxPkts. The number of packets transmitted since reset or manual clear. - RxPkts. The number of packets received since reset or manual clear. - Collisions. The number of collisions since reset or manual clear. - Tx B/s. The current line utilization-percentage of current bandwidth used. - Rx B/s. The average line utilization. - Up Time. The time elapsed since the last power cycle or reset. • ADSL Link Downstream or Upstream. The statistics for the upstream and downstream link. These statistics are of interest to your technical support representative if you have problems obtaining or maintaining a connection. • Connection Speed. Typically, the downstream speed is faster than the upstream speed. • Line Attenuation. The line attenuation increases the farther you are physically located from your ISP's facilities. • Noise Margin. The signal-to-noise ratio, which is a measure of the quality of the signal on the line. • Poll Interval. The interval at which the statistics are updated in this window. Click the Stop button to freeze the display. Network Maintenance 61
-
 1
1 -
2
-
3
-
4
-
5
-
6
-
7
-
8
-
9
-
10
-
11
-
12
-
13
-
14
-
15
-
16
-
17
-
18
-
19
-
20
-
21
-
22
-
23
-
24
-
25
-
26
-
27
-
28
-
29
-
30
-
31
-
32
-
33
-
34
-
35
-
36
-
37
-
38
-
39
-
40
-
41
-
42
-
43
-
44
-
45
-
46
-
47
-
48
-
49
-
50
-
51
-
52
-
53
-
54
-
55
-
 56
56 -
 57
57 -
 58
58 -
 59
59 -
 60
60 -
 61
61 -
 62
62 -
 63
63 -
 64
64 -
 65
65 -
 66
66 -
67
-
68
-
69
-
70
-
71
-
72
-
73
-
74
-
75
-
76
-
77
-
78
-
79
-
80
-
81
-
82
-
83
-
84
-
85
-
86
-
87
-
88
-
89
-
90
-
91
-
92
-
93
-
94
-
95
-
96
-
97
-
98
-
99
-
100
-
101
-
102
-
103
-
104
-
105
-
106
-
107
-
108
-
109
-
110
-
111
-
112
-
113
-
114
-
115
-
116
-
117
-
118
-
119
-
120
-
121
-
122
-
123
-
124
-
125
-
126
-
127
-
128
-
129
-
130
-
131
-
132
-
133
-
134
-
135
-
136
-
137
-
138
-
139
-
140
-
141
-
142
-
143
-
144
-
145
-
146
-
147
-
148
-
149
-
150
-
151
-
152
-
153
-
154
-
155
-
156
-
157
-
158
-
159
-
160
-
161
-
162
-
163
-
164
-
165
-
166
-
167
-
168
-
169
-
170
-
171
-
172
-
173
-
174
-
175
 |
 |
