| Section |
Page |
| TI-86 Graphing Calculator Guidebook |
1 |
| Important and US FCC Information |
2 |
| Table of Contents |
3 |
| TI-86 Quick Start |
3 |
| Chapter 1: Operating the TI-86 |
3 |
| Chapter 2: The CATALOG, Variables, and Characters |
4 |
| Chapter 3: Math, Calculus, and Test Operations |
5 |
| Chapter 4: Constants, Conversions, Bases, and Complex Numbers |
5 |
| Chapter 5: Function Graphing |
6 |
| Chapter 6: Graph Tools |
6 |
| Chapter 7: Tables |
7 |
| Chapter 8: Polar Graphing |
7 |
| Chapter 9: Parametric Graphing |
8 |
| Chapter 10: Differential Equation Graphing |
8 |
| Chapter 11: Lists |
9 |
| Chapter 12: Vectors |
9 |
| Chapter 13: Matrices |
9 |
| Chapter 14: Statistics |
10 |
| Chapter 15: Equation Solving |
10 |
| Chapter 16: Programming |
11 |
| Chapter 17: Memory Management |
11 |
| Chapter 18: The TI-86 Communication Link |
11 |
| Chapter 19: Applications |
12 |
| Chapter 20: A to Z Function and Instruction Reference |
12 |
| Appendix |
12 |
| Index |
12 |
| TI-86 Quick Start |
13 |
| Preparing to Use Your New TI-86 |
14 |
| Installing the AAA Batteries |
14 |
| Turning On and Turning Off the TI-86 |
14 |
| Adjusting the Contrast |
14 |
| Resetting All Memory and Defaults |
15 |
| Calculating on the Home Screen |
15 |
| Calculating the Sine of a Number |
15 |
| Storing the Last Answer to a Variable |
15 |
| Using a Variable in an Expression |
16 |
| Editing an Expression |
16 |
| Displaying a Complex Number as a Result |
17 |
| Using a List with a Function |
17 |
| Displaying the Integer Part of Real Numbers in a List |
18 |
| Removing (Exiting) a Menu |
18 |
| Finding the Square Root |
19 |
| Calculating Derivatives |
19 |
| Retrieving, Editing, and Re-evaluating the Previous Entry |
20 |
| Converting Degrees Fahrenheit to Degrees Celsius |
20 |
| Storing an Unevaluated Expression to an Equation Variable |
21 |
| Plotting Functions on the Graph Screen |
21 |
| Displaying and Entering Functions in the Equation Editor |
21 |
| Changing the Graph Style of a Function |
22 |
| Plotting a Function on the Graph Screen |
23 |
| Tracing a Function |
23 |
| Evaluating y for a Specific x Value (During a Trace) |
24 |
| Changing a Window Variable Value |
24 |
| Deselecting a Function |
25 |
| Zooming In on a Portion of the Graph Screen |
26 |
| Chapter 1: Operating the TI- 86 |
27 |
| Installing or Replacing Batteries |
28 |
| When to Replace Batteries |
28 |
| Turning On and Turning Off the TI-86 |
29 |
| Adjusting the Display Contrast |
29 |
| The Home Screen |
30 |
| Displaying Entries and Answers |
30 |
| Entering Numbers |
31 |
| Entering Negative Numbers |
31 |
| Using Scientific or Engineering Notation |
32 |
| Entering Complex Numbers |
32 |
| Entering Other Characters |
32 |
| The 2nd Key |
33 |
| The ALPHA Key |
33 |
| ALPHA-lock and alpha-lock |
33 |
| Common Cursors |
34 |
| Cursor Direction Keys |
35 |
| Inserting, Deleting, and Clearing Characters |
35 |
| Entering Expressions and Instructions |
36 |
| Entering an Expression |
36 |
| Using Functions in Expressions |
37 |
| Using an Instruction |
37 |
| Entering Functions, Instructions, and Operators |
37 |
| Entering Consecutive Entries |
38 |
| The Busy Indicator |
38 |
| Interrupting a Calculation or Graph |
38 |
| Diagnosing an Error |
39 |
| Correcting an Error |
39 |
| Reusing Previous Entries and the Last Answer |
40 |
| Retrieving the Last Entry |
40 |
| Retrieving and Editing the Last Entry |
40 |
| Retrieving Previous Entries |
40 |
| Retrieving Multiple Entries |
41 |
| Clearing the ENTRY Storage Area |
41 |
| Retrieving the Last Answer |
41 |
| Using Ans Preceding a Function |
42 |
| Storing Results to a Variable |
42 |
| Using TI-86 Menus |
43 |
| Displaying a Menu |
43 |
| The Menu Keys |
44 |
| Selecting a Menu Item |
44 |
| Exiting (Removing) a Menu |
45 |
| Viewing and Changing Modes |
46 |
| Changing a Mode Setting |
46 |
| Chapter 2: CATALOG, Variables, and Characters |
49 |
| The CATALOG |
50 |
| Storing Data to Variables |
51 |
| Creating a Variable Name |
51 |
| Storing a Value to a Variable Name |
52 |
| Storing an Unevaluated Expression |
52 |
| Storing an Answer |
53 |
| Copying a Variable Value |
53 |
| Displaying a Variable Value |
53 |
| Recalling a Variable Value |
54 |
| Classifying Variables as Data Types |
54 |
| The CATLG-VARS (CATALOG-Variables) Menu |
55 |
| Selecting a Variable Name |
56 |
| The CUSTOM Menu |
56 |
| Entering CUSTOM Menu Items |
56 |
| Clearing CUSTOM Menu Items |
57 |
| Deleting a Variable from Memory |
57 |
| The CHAR (Character) Menu |
57 |
| The CHAR MISC (Miscellaneous) Menu |
58 |
| The CHAR GREEK Menu |
58 |
| The CHAR INTL (International) Menu |
58 |
| Adding a Modifier to a Vowel |
58 |
| Chapter 3: Calculus, and Test Operations |
59 |
| Keyboard Mathematical Functions |
60 |
| The MATH Menu |
61 |
| The MATH NUM (Number) Menu |
61 |
| The MATH PROB (Probability) Menu |
62 |
| The MATH ANGLE Menu |
63 |
| The MATH HYP (Hyperbolic) Menu |
63 |
| The MATH MISC (Miscellaneous) Menu |
64 |
| The Interpolate à Extrapolate Editor |
65 |
| The CALC (Calculus) Menu |
66 |
| The TEST (Relational) Menu |
67 |
| Using Tests in Expressions and Instructions |
68 |
| Chapter 4: Constants, Conversions, Bases, and Complex Numbers |
69 |
| Using Built-In and User-Created Constants |
70 |
| The CONS (Constants) Menu |
70 |
| The CONS BLTIN (Built-In Constants) Menu |
70 |
| Creating or Redefining a User-Created Constant |
72 |
| The Constant Editor Menu |
72 |
| Entering a Constant Name in an Expression |
73 |
| Converting Units of Measure |
73 |
| Converting a Unit of Measure |
73 |
| The CONV (Conversions) Menu |
74 |
| The CONV LNGTH (Length) Menu |
75 |
| The CONV AREA Menu |
75 |
| The CONV VOL (Volume) Menu |
75 |
| The CONV TIME Menu |
75 |
| The CONV TEMP (Temperature) Menu |
75 |
| The CONV MASS Menu |
76 |
| The CONV FORCE Menu |
76 |
| The CONV PRESS (Pressure) Menu |
76 |
| The CONV ENRGY (Energy) Menu |
76 |
| The CONV POWER Menu |
76 |
| The CONV SPEED Menu |
76 |
| Converting a Value Expressed as a Rate |
77 |
| Number Bases |
77 |
| Number Base Ranges |
78 |
| One’s and Two’s Complements |
78 |
| The (Number) BASE Menu |
78 |
| The |
79 |
| The BASE A-F (Hexadecimal Characters) Menu |
79 |
| Entering Hexadecimal Digits |
79 |
| The BASE TYPE Menu |
79 |
| The BASE CONV (Conversion) Menu |
80 |
| Converting Number Bases |
80 |
| The BASE BOOL (Boolean) Menu |
80 |
| Results of Boolean Operations |
81 |
| The BASE BIT Menu |
81 |
| Using Complex Numbers |
82 |
| Complex Results |
82 |
| Using a Complex Number in an Expression |
83 |
| The CPLX (Complex Number) Menu |
83 |
| Chapter 5: Function Graphing |
85 |
| Defining a Graph |
86 |
| Setting the Graph Mode |
86 |
| The GRAPH Menu |
87 |
| Using the Equation Editor |
88 |
| The Equation Editor (GRAPH y(x)=) Menu |
88 |
| Defining a Function in the Equation Editor |
89 |
| Notes about Defining Function Equations |
90 |
| Selecting Graph Styles |
91 |
| Setting the Graph Style in the Equation Editor |
92 |
| Using Shading Patterns to Differentiate Functions |
92 |
| Viewing and Changing On à Off Status of Stat Plots |
93 |
| Setting the Window Variables |
93 |
| Displaying the Window Editor |
94 |
| Changing a Window Variable Value |
94 |
| Setting Graphing Accuracy with Delta x and Delta y |
95 |
| Setting the Graph Format |
95 |
| Displaying a Graph |
97 |
| Pausing or Stopping a Graph in Progress |
97 |
| Modifying a Drawn Graph |
97 |
| Graphing a Family of Curves |
98 |
| Smart Graph |
98 |
| Chapter 6: Graph Tools |
99 |
| Graph Tools on the TI-86 |
100 |
| The GRAPH Menu |
100 |
| Using the Free-Moving Cursor |
101 |
| Graphing Accuracy |
101 |
| Tracing a Graph |
102 |
| Stopping and Resuming a Trace |
103 |
| Resizing the Graph Screen with ZOOM Operations |
103 |
| The GRAPH ZOOM Menu |
103 |
| Defining a Custom Zoom In |
105 |
| Setting Zoom Factors |
105 |
| Zooming In and Zooming Out on a Graph |
105 |
| Storing and Recalling Zoom-Window Variable Values |
107 |
| Using Interactive Math Functions |
107 |
| The GRAPH MATH Menu |
107 |
| Settings That Affect GRAPH MATH Operations |
108 |
| Using ROOT, FMIN, FMAX, or INFLC |
109 |
| Using Integral f(x), DIST, or ARC |
110 |
| Using dy/dx or TANLN |
111 |
| Using ISECT |
112 |
| Using YICPT |
112 |
| Evaluating a Function for a Specified x |
113 |
| Drawing on a Graph |
113 |
| Before Drawing on a Graph |
114 |
| Saving and Recalling Drawn Pictures |
114 |
| Clearing Drawn Pictures |
115 |
| The GRAPH DRAW Menu |
115 |
| Shading Areas of a Graph |
116 |
| Drawing a Line Segment |
117 |
| Drawing a Vertical or Horizontal Line |
118 |
| Drawing a Circle |
118 |
| Drawing a Function, Tangent Line, or Inverse Function |
119 |
| Drawing Freehand Points, Lines, and Curves |
119 |
| Placing Text on a Graph |
120 |
| Turning On or Turning Off Points |
120 |
| Chapter 7: Tables |
122 |
| TABLE Menu |
122 |
| The Table |
122 |
| Independent and Dependent Variables in the Table |
123 |
| Navigating the Table |
123 |
| The Table Menus |
124 |
| Setting Up the Table |
125 |
| Viewing and Editing Dependent Variable Equations |
126 |
| Clearing the Table |
126 |
| Chapter 8: Polar Graphing |
127 |
| Preview: Polar Graphing |
128 |
| Defining a Polar Graph |
129 |
| Setting Polar Graphing Mode |
129 |
| The GRAPH Menu |
129 |
| Displaying the Polar Equation Editor |
130 |
| Setting the Graph Screen Window Variables |
130 |
| Setting the Graph Format |
131 |
| Displaying the Graph |
131 |
| Using Graph Tools in Pol Graphing Mode |
131 |
| The Free-Moving Cursor |
131 |
| Tracing a Polar Equation |
132 |
| Moving the Trace Cursor to a theta Value |
133 |
| Using Zoom Operations |
133 |
| The GRAPH MATH Menu |
134 |
| Evaluating an Equation for a Specified theta |
134 |
| Drawing on a Polar Graph |
134 |
| Chapter 9: Parametric Graphing |
135 |
| Preview: Parametric Graphing |
136 |
| Defining a Parametric Graph |
137 |
| Setting Parametric Graphing Mode |
138 |
| The GRAPH Menu |
138 |
| Displaying the Parametric Equation Editor |
138 |
| Selecting and Deselecting a Parametric Equation |
139 |
| Deleting a Parametric Equation |
139 |
| Setting the Graph Screen Window Variables |
139 |
| Setting the Graph Format |
140 |
| Displaying the Graph |
140 |
| Using Graph Tools in Param Graphing Mode |
140 |
| The Free-Moving Cursor |
140 |
| Tracing a Parametric Function |
140 |
| Moving the Trace Cursor to a t Value |
141 |
| Using Zoom Operations |
141 |
| The GRAPH MATH Menu |
142 |
| Evaluating an Equation for a Specified t |
142 |
| Drawing on a Parametric Graph |
142 |
| Chapter 10: Differential Equation Graphing |
143 |
| Defining a Differential Equation Graph |
144 |
| Setting Differential Equation Graphing Mode |
144 |
| The GRAPH Menu |
145 |
| Setting the Graph Format |
145 |
| Displaying the Differential Equation Editor |
146 |
| Setting the Graph Screen Window Variables |
147 |
| Setting the Initial Conditions |
148 |
| Setting the Axes |
149 |
| Differential Equation Graphing Tips |
149 |
| The Built-In Variable fldPic |
150 |
| Displaying the Graph |
150 |
| Entering and Solving Differential Equations |
151 |
| Graphing in SlpFld Format |
151 |
| Transforming an Equation into a First-Order System |
152 |
| Graphing in DirFld Format |
153 |
| Graphing a System of Equations in FldOff Format |
154 |
| Solving a Differential Equation for a Specified Value |
156 |
| Using Graph Tools in DifEq Graphing Mode |
156 |
| The Free-Moving Cursor |
156 |
| Tracing a Differential Equation |
156 |
| Moving the Trace Cursor to a t Value |
157 |
| Drawing on a Differential Equation Graph |
157 |
| Drawing an Equation and Storing Solutions to Lists |
157 |
| Using ZOOM Operations |
159 |
| Drawing Solutions Interactively with EXPLR |
160 |
| Evaluating Differential Equations for a Specified t |
162 |
| Chapter 11: Lists |
163 |
| Lists on the TI-86 |
164 |
| The LIST Menu |
164 |
| The LIST NAMES Menu |
165 |
| Creating, Storing, and Displaying Lists |
165 |
| Entering a List Directly in an Expression |
165 |
| Creating a List Name by Storing a List |
166 |
| Displaying List Elements Stored to a List Name |
166 |
| Displaying or Using a Single List Element |
167 |
| Storing a New Value to a List Element |
167 |
| Complex List Elements |
168 |
| The List Editor |
168 |
| The List Editor Menu |
168 |
| Creating a List Name in the Unnamed Column |
169 |
| Inserting a List Name into the List Editor |
169 |
| Displaying and Editing a List Element |
170 |
| Deleting Elements from a List |
170 |
| Removing a List from the List Editor |
170 |
| Using List Operations |
171 |
| The LIST OPS (Operations) Menu |
171 |
| Using Mathematical Functions with Lists |
173 |
| Attaching a Formula to a List Name |
174 |
| Comparing an Attached List with a Regular List |
175 |
| Using the List Editor to Attach a Formula |
175 |
| Using the List Editor With Attached-Formula Lists |
176 |
| Executing and Displaying Attached Formulas |
176 |
| Handling Errors Related to Attached Formulas |
177 |
| Detaching a Formula from a List Name |
178 |
| Editing an Element of a Attached-Formula List |
178 |
| Chapter 12: Vectors |
179 |
| Vectors on the TI-86 |
180 |
| Creating, Storing, and Displaying Vectors |
181 |
| The VECTR (Vector) Menu |
181 |
| The VECTR NAMES Menu |
181 |
| Creating a Vector in the Vector Editor |
181 |
| The Vector Editor Menu |
182 |
| Creating a Vector on the Home Screen |
182 |
| Creating a Complex Vector |
183 |
| Displaying a Vector |
183 |
| Using a Vector in an Expression |
184 |
| Editing Vector Dimension and Elements |
184 |
| The VECTR MATH Menu |
185 |
| The VECTR OPS (Operations) Menu |
185 |
| The VECTR CPLX (Complex) Menu |
187 |
| Using Mathematical Functions with Vectors |
188 |
| Chapter 13: Matrices |
189 |
| Matrices on the TI-86 |
190 |
| Creating, Storing, and Displaying Matrices |
190 |
| The MATRX (Matrix) Menu |
190 |
| The MATRX NAMES Menu |
190 |
| Creating a Matrix in the Matrix Editor |
190 |
| The Matrix Editor Menu |
191 |
| Creating a Matrix on the Home Screen |
192 |
| Creating a Complex Matrix |
192 |
| Displaying Matrix Elements, Rows, and Submatrices |
193 |
| Using a Matrix in an Expression |
193 |
| Editing Matrices in the Matrix Editor |
194 |
| Editing Matrices on the Home Screen |
194 |
| The MATRX MATH Menu |
195 |
| The MATRX OPS (Operations) Menu |
196 |
| The MATRX CPLX (Complex ) Menu |
197 |
| Using Mathematical Functions with Matrices |
197 |
| Chapter 14: Statistics |
199 |
| Statistical Analysis on the TI-86 |
200 |
| Setting Up a Statistical Analysis |
200 |
| The STAT (Statistics) Menu |
200 |
| Entering Statistical Data |
201 |
| The LIST NAMES Menu |
201 |
| The STAT CALC (Calculations) Menu |
201 |
| Automatic Regression Equation Storage |
203 |
| Results of a Statistical Analysis |
204 |
| The STAT VARS (Statistical Variables) Menu |
204 |
| Plotting Statistical Data |
206 |
| The STAT PLOT Status Screen |
206 |
| The STAT PLOT Menu |
207 |
| Setting Up a Stat Plot |
207 |
| Turning On and Turning Off a Stat Plot |
207 |
| The PLOT TYPE Menu (Selecting a Plot Type) |
208 |
| Plot Type Characteristics |
208 |
| The STAT DRAW Menu |
211 |
| Forecasting a Statistical Data Value |
211 |
| Chapter 15: Equation Solving |
213 |
| Preview: The Equation Solver |
214 |
| Entering an Equation in the Equation-Entry Editor |
215 |
| Setting Up the Interactive-Solver Editor |
216 |
| Entering Variable Values |
216 |
| Controlling the Solution with Bounds and a Guess |
216 |
| Editing the Equation |
217 |
| The Solver Menu |
218 |
| Solving for the Unknown Variable |
218 |
| Graphing the Solution |
219 |
| Solver Graph Tools |
219 |
| The Solver ZOOM Menu |
220 |
| The Simultaneous Equation Solver |
220 |
| Entering Equations to Solve Simultaneously |
220 |
| Storing Equation Coefficients and Results to Variables |
222 |
| The Polynomial Root-Finder |
223 |
| Entering and Solving a Polynomial |
223 |
| Storing a Polynomial Coefficient or Root to a Variable |
224 |
| Chapter 16: Programming |
225 |
| Writing a Program on the TI-86 |
226 |
| The PRGM Menu |
226 |
| Creating a Program in the Program Editor |
226 |
| The Program Editor Menu |
227 |
| The PRGM I à O (Input à Output) Menu |
227 |
| The TI-86 Key Code Diagram |
229 |
| The PRGM CTL Menu |
230 |
| Entering a Command Line |
232 |
| Menus and Screens in the Program Editor |
232 |
| Running a Program |
233 |
| Breaking (Interrupting) a Program |
234 |
| Working with Programs |
235 |
| Managing Memory and Deleting a Program |
235 |
| Editing a Program |
235 |
| Calling a Program from Another Program |
236 |
| Copying a Program to Another Program Name |
237 |
| Using and Deleting Variables within a Single Program |
237 |
| Running an Assembly Language Program |
237 |
| Entering and Storing a String |
238 |
| The STRNG (String) Menu |
239 |
| Creating a String |
239 |
| Chapter 17: Memory Management |
241 |
| Checking Available Memory |
242 |
| The MEM (Memory) Menu |
242 |
| Checking Memory Usage |
242 |
| Deleting Items from Memory |
243 |
| The MEM DELET (Delete) Menu |
243 |
| Resetting the TI-86 |
244 |
| The MEM RESET (Reset) Menu |
244 |
| ClrEnt (Clear Entry) |
244 |
| Chapter 18: The TI-86 Communication Link |
245 |
| TI-86 Linking Options |
246 |
| Linking Two TI-86s |
246 |
| Linking a TI-86 and a TI-85 |
246 |
| Linking a TI-86 and a CBL 2/CBL or CBR System |
246 |
| Linking a TI-86 and a PC or Macintosh |
247 |
| Downloading Programs from the Internet |
247 |
| Connecting the TI-86 to Another Device |
247 |
| The LINK Menu |
248 |
| Selecting Data to Send |
248 |
| The LINK SEND Menu |
248 |
| Initiating a Memory Backup |
249 |
| Selecting Variables to Send |
249 |
| The SEND WIND (Window Variables) Screen |
250 |
| Sending Variables to a TI-85 |
251 |
| The LINK SND85 (Send Data to TI-85) Menu |
251 |
| Preparing the Receiving Device |
252 |
| Transmitting Data |
252 |
| Receiving Transmitted Data |
252 |
| Repeating Transmission to Several Devices |
254 |
| Error Conditions |
254 |
| Insufficient Memory in Receiving Unit |
254 |
| Chapter 19: Applications |
255 |
| Using Math Operations with Matrices |
256 |
| Finding the Area between Curves |
257 |
| The Fundamental Theorem of Calculus |
258 |
| Electrical Circuits |
260 |
| Program: Taylor Series |
262 |
| Characteristic Polynomial and Eigenvalues |
264 |
| Convergence of the Power Series |
266 |
| Reservoir Problem |
268 |
| Predator-Prey Model |
270 |
| Program: Sierpinski Triangle |
272 |
| Chapter 20: A to Z Function and Instruction Reference |
273 |
| Quick-Find Locator |
274 |
| Graphing |
274 |
| Lists |
274 |
| Mathematics, Algebra, and Calculus |
275 |
| Matrices |
276 |
| Programming |
276 |
| Statistics |
276 |
| Strings |
277 |
| Vectors |
277 |
| Alphabetical Listing of Operations |
278 |
| A |
279 |
| abs |
279 |
| Addition: + |
279 |
| and |
280 |
| angle |
281 |
| Ans |
281 |
| arc( |
281 |
| Asm( |
281 |
| AsmComp( |
282 |
| AsmPrgm |
282 |
| Assignment = |
282 |
| aug( |
282 |
| Axes( |
283 |
| AxesOff |
283 |
| AxesOn |
283 |
| B |
283 |
| b (integer b) |
283 |
| Bin |
284 |
| Box |
284 |
| C |
285 |
| Circl( |
285 |
| ClDrw |
285 |
| CILCD |
285 |
| ClrEnt |
285 |
| ClTbl |
285 |
| cnorm |
285 |
| Concatenation: + |
286 |
| cond |
286 |
| conj |
287 |
| CoordOff |
287 |
| CoordOn |
287 |
| cos |
288 |
| cos^-1 |
288 |
| cosh |
289 |
| cosh^-1 |
289 |
| cross( |
289 |
| cSum( |
290 |
| >Cyl |
290 |
| CylV |
290 |
| D |
290 |
| d (number d) |
290 |
| Dec |
290 |
| Degree |
291 |
| Degree entry: ° |
291 |
| Deltalst( |
291 |
| DelVar( |
292 |
| der1( |
292 |
| der2( |
292 |
| det |
293 |
| DifEq |
293 |
| dim |
293 |
| -> dim |
293 |
| dimL |
294 |
| -> dimL |
294 |
| DirFld |
294 |
| Disp |
295 |
| DispG |
295 |
| DispT |
296 |
| Division: / |
296 |
| DMS engry: ' |
297 |
| >DMS |
297 |
| dot( |
297 |
| DrawDot |
297 |
| DrawF |
298 |
| DrawLine |
298 |
| DrEqu( |
299 |
| DrInv |
299 |
| DS<( |
300 |
| dxDer1 |
300 |
| dxNDer |
300 |
| E |
300 |
| e^ |
300 |
| eigVc |
301 |
| eigVl |
301 |
| Else |
302 |
| End |
302 |
| Eng |
302 |
| Eq>St( |
302 |
| Equal: = |
302 |
| Equal to: == |
303 |
| Euler |
303 |
| eval |
303 |
| evalF( |
304 |
| Exponent: E |
304 |
| ExpR |
305 |
| F |
306 |
| Factorial: ! |
306 |
| fcstx |
306 |
| fcsty |
306 |
| Fill( |
307 |
| Fix |
307 |
| FldOff |
307 |
| Float |
307 |
| fMax( |
308 |
| fMin( |
308 |
| fnInt( |
308 |
| FnOff |
308 |
| FnOn |
309 |
| For( |
309 |
| Form( |
310 |
| fPart |
310 |
| >Frac |
310 |
| Func |
311 |
| G |
311 |
| gcd( |
311 |
| Get( |
311 |
| getKy |
312 |
| Goto |
312 |
| Greater than: > |
312 |
| Greater than or equal to: |
313 |
| GridOff |
313 |
| GridOn |
314 |
| GrStl( |
314 |
| H |
314 |
| h (integer h) |
314 |
| Hex |
314 |
| >Hex |
315 |
| Hist |
315 |
| Horiz |
316 |
| I |
316 |
| IAsk |
316 |
| IAuto |
316 |
| ident |
316 |
| If |
317 |
| imag |
318 |
| InpSt |
319 |
| Input |
319 |
| int |
320 |
| inter( |
321 |
| Inverse: ^-1 |
321 |
| iPart |
321 |
| IS>( |
322 |
| L |
322 |
| LabelOff |
322 |
| LabelOn |
322 |
| Lbl |
323 |
| lcm( |
323 |
| LCust( |
323 |
| Less than: < |
324 |
| Less than or equal to: |
324 |
| LgstR |
325 |
| Line( |
326 |
| LinR |
327 |
| List entry: { } |
328 |
| li>vc |
328 |
| ln |
328 |
| lngth |
328 |
| LnR |
329 |
| log |
330 |
| LU( |
330 |
| M |
331 |
| Matrix entry: [ ] |
331 |
| max( |
331 |
| MBox |
331 |
| Menu( |
332 |
| min( |
332 |
| mod( |
332 |
| mRAdd( |
333 |
| Multiplication: * |
333 |
| multR( |
334 |
| N |
334 |
| nCr |
334 |
| nDer( |
335 |
| Negation: - |
335 |
| norm |
335 |
| Normal |
336 |
| not |
337 |
| nPr |
338 |
| O |
338 |
| o (integer o) |
338 |
| Oct |
339 |
| >Oct |
339 |
| OneVar |
339 |
| or |
340 |
| Outpt( |
341 |
| P |
342 |
| P2Reg |
342 |
| P3Reg |
343 |
| P4Reg |
344 |
| Param |
345 |
| Pause |
345 |
| Percent % |
346 |
| pEval( |
346 |
| PlOff |
346 |
| PlOn |
346 |
| Plot1( |
347 |
| Plot2( |
347 |
| Plot3( |
347 |
| Pol |
348 |
| >Pol |
348 |
| PolarC |
348 |
| Polar complex: |
348 |
| PolarGC |
348 |
| poly |
349 |
| Power: ^ |
349 |
| Power of 10: 10^ |
349 |
| prod |
350 |
| Prompt |
350 |
| PtChg( |
350 |
| PtOff( |
350 |
| PtOn( |
350 |
| PwrR |
351 |
| PxChg( |
352 |
| PxOff( |
352 |
| PxOn( |
352 |
| PxTest( |
352 |
| R |
352 |
| rAdd( |
352 |
| Radian |
353 |
| Radian entry: r |
353 |
| rand |
353 |
| randBin( |
353 |
| randInt( |
354 |
| randM( |
354 |
| randNorm( |
354 |
| RcGDB |
355 |
| RcPic |
355 |
| real |
355 |
| >Rec |
355 |
| RectC |
356 |
| RectGC |
356 |
| RectV |
356 |
| ref |
356 |
| Repeat |
357 |
| Return |
357 |
| RK |
357 |
| rnorm |
358 |
| Root: |
358 |
| rotL |
359 |
| rotR |
359 |
| round( |
360 |
| rref |
360 |
| rSwap( |
360 |
| S |
361 |
| Scatter |
361 |
| Sci |
361 |
| Select( |
362 |
| Send( |
362 |
| seq( |
363 |
| SeqG |
363 |
| SetLEdit |
363 |
| Shade( |
364 |
| shftL |
365 |
| shftR |
365 |
| ShwSt |
366 |
| sign |
366 |
| SimulG |
366 |
| simult( |
366 |
| sin |
367 |
| sin^-1 |
367 |
| sinh |
368 |
| sinh^-1 |
368 |
| SinR |
369 |
| SlpFld |
370 |
| Solver( |
370 |
| sortA |
371 |
| sortD |
371 |
| Sortx |
371 |
| Sorty |
371 |
| >Sph |
372 |
| SphereV |
372 |
| St>Eq( |
373 |
| StGDB |
373 |
| Stop |
374 |
| Store to variable: |
374 |
| StPic |
374 |
| StReg( |
374 |
| String entry: \ |
375 |
| sub( |
375 |
| Subtraction: - |
375 |
| sum |
376 |
| T |
376 |
| tan |
376 |
| tan^-1 |
377 |
| tanh |
377 |
| tanh^-1 |
377 |
| TanLn( |
378 |
| Text( |
378 |
| Then |
378 |
| Trace |
379 |
| Transpose: T |
379 |
| TwoVar |
380 |
| U |
380 |
| unitV |
380 |
| V |
381 |
| vc>li |
381 |
| Vector entry: [ ] |
381 |
| Vert |
381 |
| W |
381 |
| While |
381 |
| X |
382 |
| xor |
382 |
| xyline |
382 |
| Z |
383 |
| ZData |
383 |
| ZDecm |
384 |
| ZFit |
385 |
| ZIn |
385 |
| ZInt |
386 |
| ZOut |
387 |
| ZPrev |
387 |
| ZRcl |
388 |
| ZSqr |
388 |
| ZStd |
389 |
| ZTrig |
390 |
| Appendix A |
391 |
| TI-86 Menu Map |
392 |
| Handling a Difficulty |
404 |
| Error Conditions |
405 |
| Equation Operating System (EOS™) |
409 |
| Implied Multiplication |
409 |
| Parentheses |
409 |
| TOL (The Tolerance Editor) |
410 |
| Computational Accuracy |
411 |
| Support and Service Information |
412 |
| Product Support |
412 |
| Product Service |
413 |
| Other TI Products and Services |
413 |
| Warranty Information |
414 |
| Customers in the U.S. and Canada Only |
414 |
| Australia & New Zealand Customers only |
415 |
| All Customers outside the U.S. and Canada |
416 |
| Index |
417 |
| A, B |
417 |
| C |
418 |
| D |
419 |
| E |
420 |
| F |
421 |
| G |
422 |
| H, I, K, L |
423 |
| M |
424 |
| N, O |
425 |
| P |
426 |
| Q, R |
427 |
| S |
428 |
| T |
429 |
| U, V, W, X |
430 |

 1
1 86
86 87
87 88
88 89
89 90
90 91
91 92
92 93
93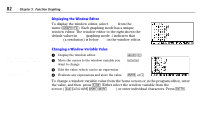 94
94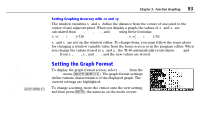 95
95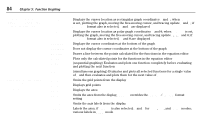 96
96

