Texas Instruments TINSPIRE Data Collection Guidebook - Page 3

Contents, Analyzing the Data in Table View - manual

Page 3 highlights

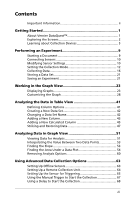
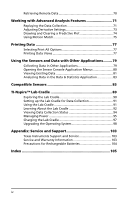
Contents Important Information ii Getting Started 1 About Vernier DataQuest 1 Exploring the Screens 2 Learning about Collection Devices 5 Performing an Experiment 9 Starting a Document 9 Connecting Sensors 10 Modifying Sensor Settings 10 Setting the Collection Mode 12 Collecting Data 16 Storing a Data Set 21 Saving an Experiment 21 Working in the Graph View 23 Displaying Graphs 23 Customizing the Graph 28 Analyzing the Data in Table View 41 Defining Column Options 41 Creating a New Data Set 42 Changing a Data Set Name 42 Adding a New Column 43 Adding a New Calculated Column 45 Striking and Restoring Data 47 Analyzing Data in Graph View 51 Viewing Data for Analysis 51 Interpolating the Value Between Two Data Points 53 Finding the Slope 53 Finding the Area Under a Data Plot 54 Removing Analysis Options 60 Using Advanced Data Collection Options 63 Setting Up Offline Sensors 63 Setting Up a Remote Collection Unit 64 Setting Up the Sensor for Triggering 65 Using the Manual Trigger to Start the Collection 67 Using a Delay to Start the Collection 68 iii

  • 1
  • 2
  • 3
  • 4
  • 5
  • 6
  • 7
  • 8
  • 9
  • 10
  • 11
  • 12
  • 13
  • 14
  • 15
  • 16
  • 17
  • 18
  • 19
  • 20
  • 21
  • 22
  • 23
  • 24
  • 25
  • 26
  • 27
  • 28
  • 29
  • 30
  • 31
  • 32
  • 33
  • 34
  • 35
  • 36
  • 37
  • 38
  • 39
  • 40
  • 41
  • 42
  • 43
  • 44
  • 45
  • 46
  • 47
  • 48
  • 49
  • 50
  • 51
  • 52
  • 53
  • 54
  • 55
  • 56
  • 57
  • 58
  • 59
  • 60
  • 61
  • 62
  • 63
  • 64
  • 65
  • 66
  • 67
  • 68
  • 69
  • 70
  • 71
  • 72
  • 73
  • 74
  • 75
  • 76
  • 77
  • 78
  • 79
  • 80
  • 81
  • 82
  • 83
  • 84
  • 85
  • 86
  • 87
  • 88
  • 89
  • 90
  • 91
  • 92
  • 93
  • 94
  • 95
  • 96
  • 97
  • 98
  • 99
  • 100
  • 101
  • 102
  • 103
  • 104
  • 105
  • 106
  • 107
  • 108
  • 109
  • 110
  • 111
  • 112

Contents
iii
Important Information
...................................................................
ii
Getting Started
.......................................................................
1
About Vernier DataQuestâ„¢
...........................................................
1
Exploring the Screens
.....................................................................
2
Learning about Collection Devices
................................................
5
Performing an Experiment
.....................................................
9
Starting a Document
......................................................................
9
Connecting Sensors
......................................................................
10
Modifying Sensor Settings
...........................................................
10
Setting the Collection Mode
........................................................
12
Collecting Data
.............................................................................
16
Storing a Data Set
........................................................................
21
Saving an Experiment
..................................................................
21
Working in the Graph View
..................................................
23
Displaying Graphs
.........................................................................
23
Customizing the Graph
................................................................
28
Analyzing the Data in Table View
........................................
41
Defining Column Options
............................................................
41
Creating a New Data Set
..............................................................
42
Changing a Data Set Name
..........................................................
42
Adding a New Column
.................................................................
43
Adding a New Calculated Column
..............................................
45
Striking and Restoring Data
........................................................
47
Analyzing Data in Graph View
.............................................
51
Viewing Data for Analysis
............................................................
51
Interpolating the Value Between Two Data Points
....................
53
Finding the Slope
.........................................................................
53
Finding the Area Under a Data Plot
............................................
54
Removing Analysis Options
.........................................................
60
Using Advanced Data Collection Options
...........................
63
Setting Up Offline Sensors
...........................................................
63
Setting Up a Remote Collection Unit
..........................................
64
Setting Up the Sensor for Triggering
..........................................
65
Using the Manual Trigger to Start the Collection
......................
67
Using a Delay to Start the Collection
..........................................
68