Casio FX300ES Operating Guide - Page 24
Obtaining Statistical Values from Input Data - standard deviation
 |
UPC - 079767171223
View all Casio FX300ES manuals
Add to My Manuals
Save this manual to your list of manuals |
Page 24 highlights
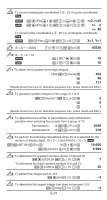
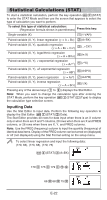
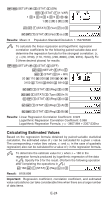
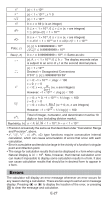
Important: • All data currently input in the Stat Editor is deleted whenever you exit the STAT Mode, switch between the single-variable and a pairedvariable statistical calculation type, or change the Stat Format setting on the setup menu. • The following operations are not supported by the Stat Editor: m, 1m(M-), 1t(STO). Pol, Rec, ÷R, and multi-statements also cannot be input with the Stat Editor. To change the data in a cell: In the Stat Editor, move the cursor to the cell that contains the data you want to change, input the new data, and then press =. To delete a line: In the Stat Editor, move the cursor to the line that you want to delete and then press Y. To insert a line: In the Stat Editor, move the cursor to the location where you want to insert the line and then perform the following key operation: 11(STAT)3(Edit)1(Ins). To delete all Stat Editor contents: In the Stat Editor, perform the following key operation: 11(STAT)3(Edit)2(Del-A). Obtaining Statistical Values from Input Data To obtain statistical values, press A while in the Stat Editor and then recall the statistical variable (σx, Σx2, etc.) you want. Supported statistical variables and the keys you should press to recall them are shown below. For single-variable statistical calculations, the variables marked with an asterisk (*) are available. Sum: Σx2*, Σx*, Σy2, Σy, Σxy, Σx3, Σx2y, Σx4 11(STAT) 3(Sum) 1 to 8 Number of Items: n*, Mean: o*, p, Population Standard Deviation: σx*, σy, Sample Standard Deviation: sx*, sy 11(STAT) 4(Var) 1 to 7 Minimum Value: minX*, minY, Maximum Value: maxX*, maxY 11(STAT) 5(MinMax) 1 to 2 (When the single-variable statistical calculation is selected) 11(STAT) 6(MinMax) 1 to 4 (When a paired-variable statistical calculation is selected) First Quartile: Q1, Median: med, Third Quartile: Q3 11(STAT) 5(MinMax) 3 to 5 (When the single-variable statistical calculation is selected.) Regression Coefficients: A, B, Correlation Coefficient: r, Estimated Values: m, n 11(STAT) 5(Reg) 1 to 5 Regression Coefficients for Quadratic Regression: A, B, C, Estimated Values: m1, m2, n 11(STAT) 5(Reg) 1 to 6 • See the table at the beginning of this section of the manual for the regression formulas. • m, m1, m2 and n are not variables. They are commands of the type that take an argument immediately before them. See "Calculating Estimated Values" for more information. 2 To input the single-variable data x = {1, 2, 2, 3, 3, 3, 4, 4, 5}, using the FREQ column to specify the number of repeats for each items ({xn; freqn} = {1;1, 2;2, 3;3, 4;2, 5;1}), and calculate the mean and population standard deviation. E-23
-
 1
1 -
2
-
3
-
4
-
5
-
6
-
7
-
8
-
9
-
10
-
11
-
12
-
13
-
14
-
15
-
16
-
17
-
18
-
 19
19 -
 20
20 -
 21
21 -
 22
22 -
 23
23 -
 24
24 -
 25
25 -
 26
26 -
 27
27 -
 28
28 -
 29
29 -
30
-
31
-
32
 |
 |