Casio FX300ES Operating Guide - Page 25
Calculating Estimated Values
 |
UPC - 079767171223
View all Casio FX300ES manuals
Add to My Manuals
Save this manual to your list of manuals |
Page 25 highlights
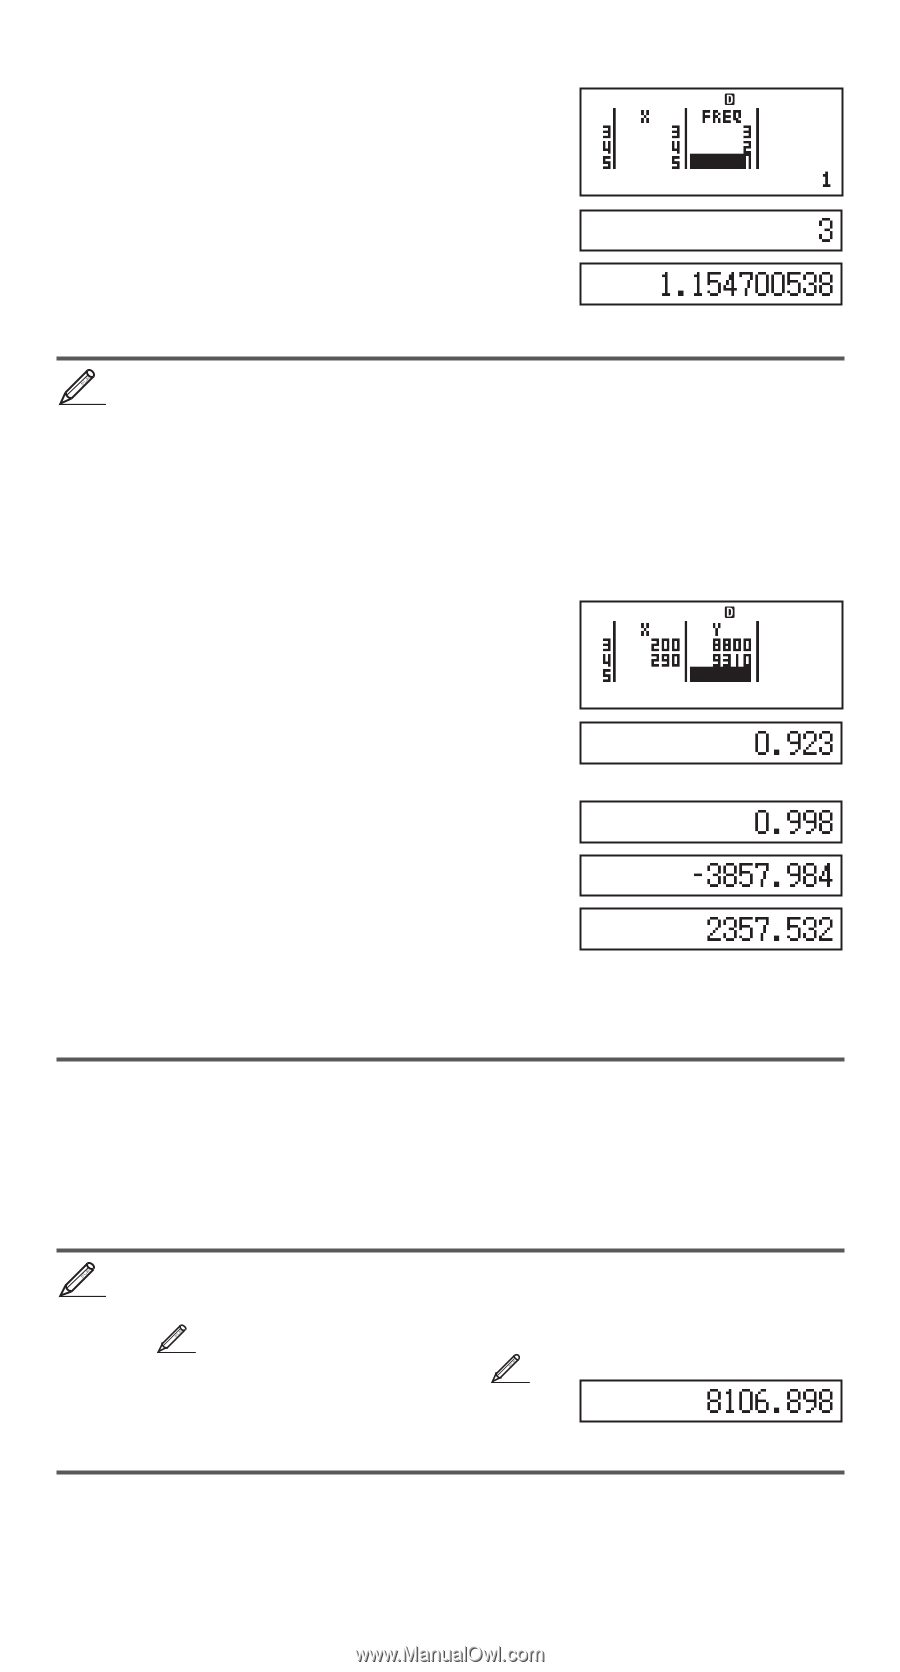
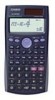
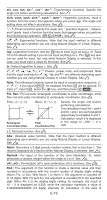
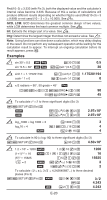
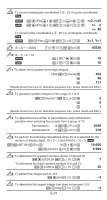
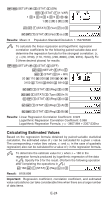
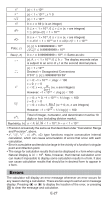
1N(SETUP)c3(STAT)1(ON) N2(STAT)1(1-VAR) STAT 1 = 2 = 3 = 4 = 5 =ce 1 = 2 = 3 = 2 = A11(STAT)4(Var)2(o)= A11(STAT)4(Var)3(σx)= Results: Mean: 3 Population Standard Deviation: 1.154700538 3 To calculate the linear regression and logarithmic regression correlation coefficients for the following paired-variable data and determine the regression formula for the strongest correlation: (x, y) = (20, 3150), (110, 7310), (200, 8800), (290, 9310). Specify Fix 3 (three decimal places) for results. 1N(SETUP)c3(STAT)2(OFF) 1N(SETUP)6(Fix)3 N2(STAT)2(A + BX) STAT FIX 20 = 110 = 200 = 290 =ce 3150 = 7310 =8800 = 9310= A11(STAT)5(Reg)3(r)= A11(STAT)1(Type)4(In X) A11(STAT)5(Reg)3(r)= A11(STAT)5(Reg)1(A)= A11(STAT)5(Reg)2(B)= Results: Linear Regression Correlation Coefficient: 0.923 Logarithmic Regression Correlation Coefficient: 0.998 Logarithmic Regression Formula: y = -3857.984 + 2357.532lnx Calculating Estimated Values Based on the regression formula obtained by paired-variable statistical calculation, the estimated value of y can be calculated for a given x-value. The corresponding x-value (two values, x1 and x2, in the case of quadratic regression) also can be calculated for a value of y in the regression formula. 4 To determine the estimate value for y when x = 160 in the regression formula produced by logarithmic regression of the data in 3. Specify Fix 3 for the result. (Perform the following operation after completing the operations in 3.) A 160 11(STAT)5(Reg)5(n)= Result: 8106.898 Important: Regression coefficient, correlation coefficient, and estimated value calculations can take considerable time when there are a large number of data items. E-24
-
 1
1 -
2
-
3
-
4
-
5
-
6
-
7
-
8
-
9
-
10
-
11
-
12
-
13
-
14
-
15
-
16
-
17
-
18
-
19
-
 20
20 -
 21
21 -
 22
22 -
 23
23 -
 24
24 -
 25
25 -
 26
26 -
 27
27 -
 28
28 -
 29
29 -
 30
30 -
31
-
32
 |
 |