Dell PowerConnect W-IAP3WN Dell Instant 5.0.3.0-1.1.0.0 User Guide - Page 118
Info, RF Dashboard, Usage Trends, Country Code, IP address, Content filtering, Organization
 |
View all Dell PowerConnect W-IAP3WN manuals
Add to My Manuals
Save this manual to your list of manuals |
Page 118 highlights
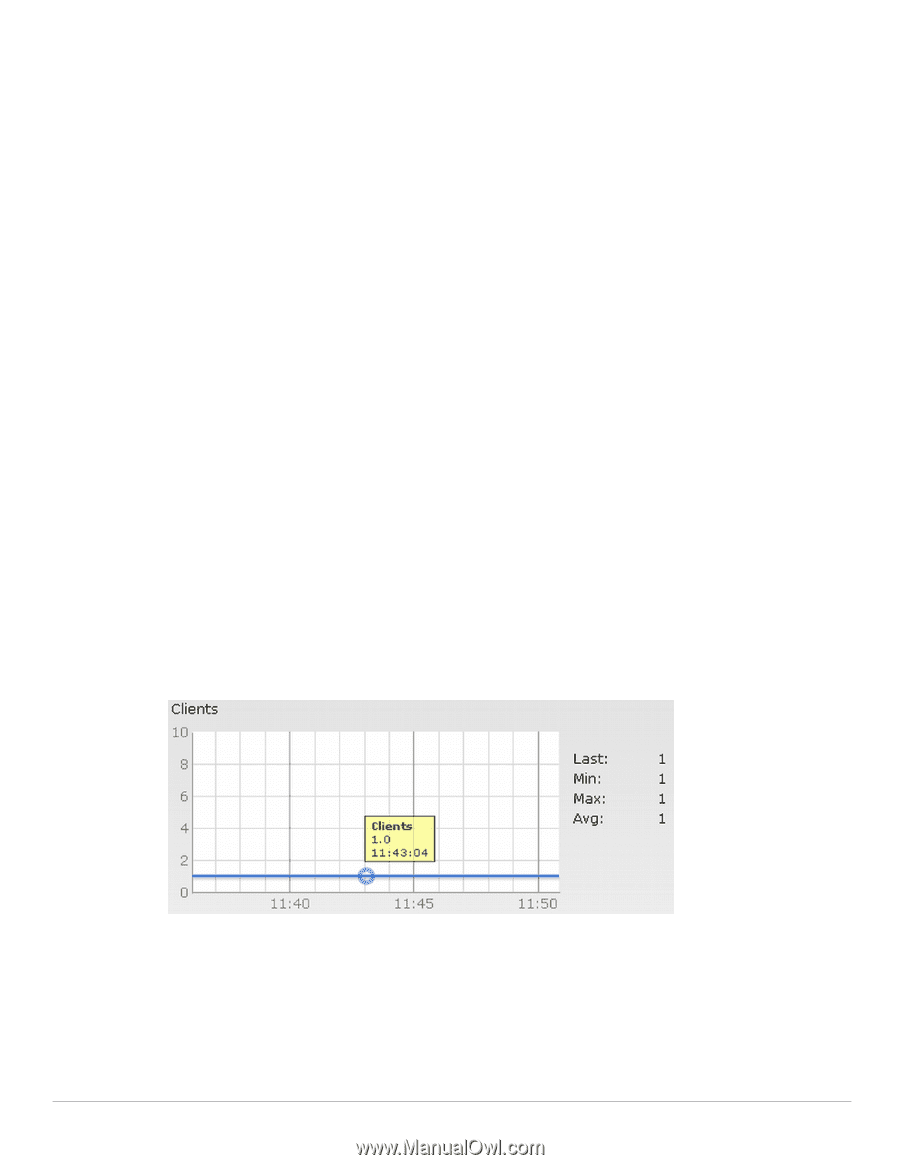
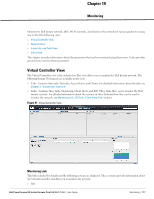
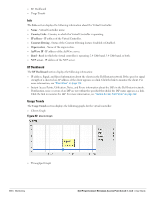
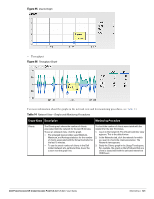
RF Dashboard Usage Trends Info The Info section displays the following information about the Virtual Controller: Name - Virtual Controller name. Country Code - Country in which the Virtual Controller is operating. IP address - IP address of the Virtual Controller. Content filtering - Status of the Content Filtering feature: Enabled or Disabled. Organization - Name of the organization. AirWave IP - IP address of the AirWave server. Band - Band in which the virtual controller is operating: 2.4 GHz band, 5.4 GHz band, or both. NTP server - IP address of the NTP server. RF Dashboard The RF Dashboard section displays the following information: IP address, Signal, and Speed information about the clients in the Dell Instant network. If the speed or signal strength of a client is low, IP address of the client appears as a link. Click the link to monitor the client. For more information, see "Client View" on page 125. Instant Access Points, Utilization, Noise, and Errors information about the IAPs in the Dell Instant network. If utilization, noise or errors of an IAP are not within the specified threshold, the IAP name appears as a link. Click the link to monitor the IAP. For more information, see "Instant Access Point View" on page 122. Usage Trends The Usage Trends section displays the following graphs for the virtual controller: Clients Graph Figure 92 Clients Graph Throughput Graph 118 | Monitoring Dell PowerConnect W-Instant Access Point 5.0.3.0-1.1.0.0 | User Guide
-
 1
1 -
2
-
3
-
4
-
5
-
6
-
7
-
8
-
9
-
10
-
11
-
12
-
13
-
14
-
15
-
16
-
17
-
18
-
19
-
20
-
21
-
22
-
23
-
24
-
25
-
26
-
27
-
28
-
29
-
30
-
31
-
32
-
33
-
34
-
35
-
36
-
37
-
38
-
39
-
40
-
41
-
42
-
43
-
44
-
45
-
46
-
47
-
48
-
49
-
50
-
51
-
52
-
53
-
54
-
55
-
56
-
57
-
58
-
59
-
60
-
61
-
62
-
63
-
64
-
65
-
66
-
67
-
68
-
69
-
70
-
71
-
72
-
73
-
74
-
75
-
76
-
77
-
78
-
79
-
80
-
81
-
82
-
83
-
84
-
85
-
86
-
87
-
88
-
89
-
90
-
91
-
92
-
93
-
94
-
95
-
96
-
97
-
98
-
99
-
100
-
101
-
102
-
103
-
104
-
105
-
106
-
107
-
108
-
109
-
110
-
111
-
112
-
 113
113 -
 114
114 -
 115
115 -
 116
116 -
 117
117 -
 118
118 -
 119
119 -
 120
120 -
 121
121 -
 122
122 -
 123
123 -
124
-
125
-
126
-
127
-
128
-
129
-
130
-
131
-
132
-
133
-
134
-
135
-
136
-
137
-
138
-
139
-
140
 |
 |