Dell PowerConnect W-IAP3WN Dell Instant 6.1.3.1-3.0.0.0 User Guide - Page 182
Table 28, Instant Access Point View - RF Trends Graphs and Monitoring Procedures
 |
View all Dell PowerConnect W-IAP3WN manuals
Add to My Manuals
Save this manual to your list of manuals |
Page 182 highlights
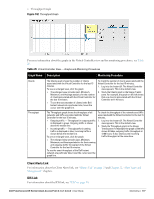
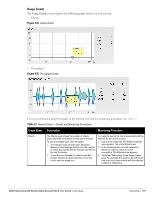
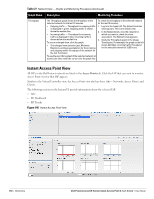
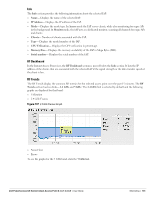
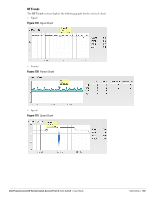
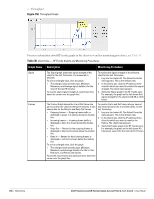
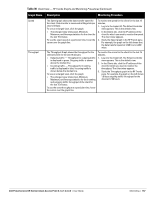
For more information about the graphs in the instant access point view and for monitoring procedures, see Table 28. Table 28 Instant Access Point View - RF Trends Graphs and Monitoring Procedures Graph Name Description Monitoring Procedure Utilization The Utilization graph shows the radio utilization percentage of the access point for the last 15 minutes. To see an enlarged view, click the graph. The enlarged view provides Last, Minimum, Maximum, and Average radio utilization statistics for the IAP for the last 15 minutes. To see the exact utilization percent at a particular time, hover the cursor over the graph line. To monitor the utilization of the selected IAP for the last 15 minutes, 1. Log in to the Instant UI. The Virtual Controller view appears. This is the default view. 2. In the Access Points tab, click the IAP for which you want to monitor the utilization. The IAP view appears. 3. Study the Utilization graph in the RF Trends pane. For example, the graph on the left shows 62% IAP radio utilization for the 2.4 GHz band at 22:28 hours. NOTE: You can also click the rectangle icon under the Utilization column in the RF Dashboard pane to see the Utilization graph for the selected IAP. The rectangle icon is seen as follows: 2.4 GHz Frames Noise Floor The 2.4 GHz Frames graph shows the In and Out frame rate per second for the radio in 2.4 GHz band for the last 15 minutes. Outgoing frames - Outgoing frame traffic is displayed in green. It is shown above the median line. Incoming frames - Incoming frame traffic is displayed in blue. It is shown below the median line. To see an enlarged view, click the graph. The enlarged view provides Last, Minimum, Maximum, and Average statistics for the incoming and outgoing frames. To see the exact utilization percent at a particular time, hover the cursor over the graph line. To monitor the In and Out frame rate per second for the radio in 2.4 GHz band, for the last 15 minutes, 1. Log in to the WebUI. The Virtual Controller view appears. This is the default view. 2. In the Access Points tab, click the name link of the IAP for which you want to monitor the frame rate. The IAP view appears. 3. Study the 2.4 GHz Frames graph in the RF Trends pane. For example, the graph on the left shows 1537.0 incoming frames at 22:31 hours. The Noise Floor graph shows the signals created by all the noise sources and unwanted signals in the network. Noise floor is measured in decibels/metre. Too many unwanted signals hamper the performance of the IAP. Monitor the noise floor regularly for optimal performance of the IAP. To see an enlarged view, click the graph. The enlarged view provides Last, Minimum, Maximum, and Average statistics for the In and Out frames. To see the exact utilization percent at a particular time, hover the cursor over the graph line. To monitor the noise floor for the IAP for the last 15 minutes, 1. Log in to the WebUI. The Virtual Controller view appears. This is the default view. 2. In the Access Points tab, click the name link of the IAP for which you want to monitor the noise floor. The IAP view appears. 3. Study the Noise Floor graph in the RF Trends pane. For example, the graph on the left shows that the noise floor for the IAP at 22:38 hours is -82.0 dBm. NOTE: You can also click the rectangle icon the Noise column in the RF Dashboard pane to see the Noise graph for the selected IAP. The rectangle icon is seen as follows: 182 | Monitoring Dell PowerConnect W-Series Instant Access Point 6.1.3.1-3.0.0.0 | User Guide
-
 1
1 -
2
-
3
-
4
-
5
-
6
-
7
-
8
-
9
-
10
-
11
-
12
-
13
-
14
-
15
-
16
-
17
-
18
-
19
-
20
-
21
-
22
-
23
-
24
-
25
-
26
-
27
-
28
-
29
-
30
-
31
-
32
-
33
-
34
-
35
-
36
-
37
-
38
-
39
-
40
-
41
-
42
-
43
-
44
-
45
-
46
-
47
-
48
-
49
-
50
-
51
-
52
-
53
-
54
-
55
-
56
-
57
-
58
-
59
-
60
-
61
-
62
-
63
-
64
-
65
-
66
-
67
-
68
-
69
-
70
-
71
-
72
-
73
-
74
-
75
-
76
-
77
-
78
-
79
-
80
-
81
-
82
-
83
-
84
-
85
-
86
-
87
-
88
-
89
-
90
-
91
-
92
-
93
-
94
-
95
-
96
-
97
-
98
-
99
-
100
-
101
-
102
-
103
-
104
-
105
-
106
-
107
-
108
-
109
-
110
-
111
-
112
-
113
-
114
-
115
-
116
-
117
-
118
-
119
-
120
-
121
-
122
-
123
-
124
-
125
-
126
-
127
-
128
-
129
-
130
-
131
-
132
-
133
-
134
-
135
-
136
-
137
-
138
-
139
-
140
-
141
-
142
-
143
-
144
-
145
-
146
-
147
-
148
-
149
-
150
-
151
-
152
-
153
-
154
-
155
-
156
-
157
-
158
-
159
-
160
-
161
-
162
-
163
-
164
-
165
-
166
-
167
-
168
-
169
-
170
-
171
-
172
-
173
-
174
-
175
-
176
-
 177
177 -
 178
178 -
 179
179 -
 180
180 -
 181
181 -
 182
182 -
 183
183 -
 184
184 -
 185
185 -
 186
186 -
 187
187 -
188
-
189
-
190
-
191
-
192
-
193
-
194
-
195
-
196
-
197
-
198
-
199
-
200
-
201
-
202
-
203
-
204
-
205
-
206
-
207
-
208
-
209
-
210
-
211
-
212
-
213
-
214
 |
 |
