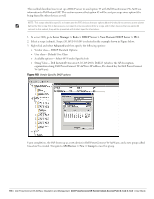
Dell PowerConnect W-IAP3WN Dell Instant 6.1.3.4-3.1.0.0 User Guide - Page 201
Table 37, Graph Name, Description, Monitoring Procedure
 |
View all Dell PowerConnect W-IAP3WN manuals
Add to My Manuals
Save this manual to your list of manuals |
Page 201 highlights
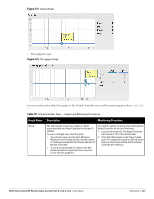
Figure 173 Clients Graph Throughput Graph Figure 174 Throughput Graph For more information about the graphs in the Virtual Controller view and for monitoring procedures, see Table 37. Table 37 Virtual Controller View - Graphs and Monitoring Procedures Graph Name Description Monitoring Procedure Clients The Clients graph shows the number of clients associated with the Virtual Controller for the last 15 minutes. To see an enlarged view, click the graph. The enlarged view provides Last, Minimum, Maximum, and Average statistics for the number of clients associated with the Virtual Controller for the last 15 minutes. To see the exact number of clients in the Dell Instant network at a particular time, hover the cursor over the graph line. To check the number of clients associated with the Virtual Controller for the last 15 minutes, 1. Log in to the Instant UI. The Virtual Controller view appears. This is the default view. 2. Study the Clients graph in the Usage Trends pane. For example, the graph on the left shows that one client is associated with the Virtual Controller at 11:43 hours. Dell PowerConnect W-Series Instant Access Point 6.1.3.4-3.1.0.0 | User Guide Monitoring | 201
-
 1
1 -
2
-
3
-
4
-
5
-
6
-
7
-
8
-
9
-
10
-
11
-
12
-
13
-
14
-
15
-
16
-
17
-
18
-
19
-
20
-
21
-
22
-
23
-
24
-
25
-
26
-
27
-
28
-
29
-
30
-
31
-
32
-
33
-
34
-
35
-
36
-
37
-
38
-
39
-
40
-
41
-
42
-
43
-
44
-
45
-
46
-
47
-
48
-
49
-
50
-
51
-
52
-
53
-
54
-
55
-
56
-
57
-
58
-
59
-
60
-
61
-
62
-
63
-
64
-
65
-
66
-
67
-
68
-
69
-
70
-
71
-
72
-
73
-
74
-
75
-
76
-
77
-
78
-
79
-
80
-
81
-
82
-
83
-
84
-
85
-
86
-
87
-
88
-
89
-
90
-
91
-
92
-
93
-
94
-
95
-
96
-
97
-
98
-
99
-
100
-
101
-
102
-
103
-
104
-
105
-
106
-
107
-
108
-
109
-
110
-
111
-
112
-
113
-
114
-
115
-
116
-
117
-
118
-
119
-
120
-
121
-
122
-
123
-
124
-
125
-
126
-
127
-
128
-
129
-
130
-
131
-
132
-
133
-
134
-
135
-
136
-
137
-
138
-
139
-
140
-
141
-
142
-
143
-
144
-
145
-
146
-
147
-
148
-
149
-
150
-
151
-
152
-
153
-
154
-
155
-
156
-
157
-
158
-
159
-
160
-
161
-
162
-
163
-
164
-
165
-
166
-
167
-
168
-
169
-
170
-
171
-
172
-
173
-
174
-
175
-
176
-
177
-
178
-
179
-
180
-
181
-
182
-
183
-
184
-
185
-
186
-
187
-
188
-
189
-
190
-
191
-
192
-
193
-
194
-
195
-
 196
196 -
 197
197 -
 198
198 -
 199
199 -
 200
200 -
 201
201 -
 202
202 -
 203
203 -
 204
204 -
 205
205 -
 206
206 -
207
-
208
-
209
-
210
-
211
-
212
-
213
-
214
-
215
-
216
-
217
-
218
-
219
-
220
-
221
-
222
-
223
-
224
-
225
-
226
-
227
-
228
-
229
-
230
-
231
-
232
-
233
-
234
-
235
-
236
-
237
-
238
-
239
-
240
-
241
-
242
-
243
-
244
-
245
-
246
 |
 |
