Garmin GPSMAP 4012 Owner's Manual - Page 20
Using Fish Eye 3D, Using Fishing Charts, Fish Eye 3D Settings - transducer
 |
UPC - 753759066055
View all Garmin GPSMAP 4012 manuals
Add to My Manuals
Save this manual to your list of manuals |
Page 20 highlights
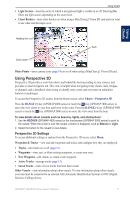
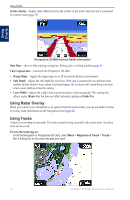
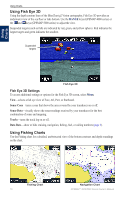
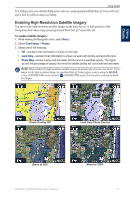
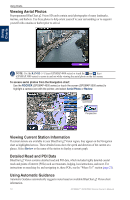
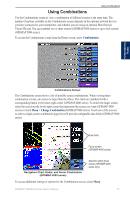
Using Charts Using Charts Using Fish Eye 3D Using the depth contour lines of the BlueChart g2 Vision cartography, Fish Eye 3D provides an underwater view of the sea floor or lake bottom. Use the RANGE keys (GPSMAP 4000 series) or the and keys (GPSMAP 5000 series) to adjust the view. Suspended targets (such as fish) are indicated by red, green, and yellow spheres. Red indicates the largest targets and green indicates the smallest. Suspended targets Fish Eye 3D Fish Eye 3D Settings To access additional settings or options for the Fish Eye 3D screen, select Menu. View-selects a fish eye view of Fore, Aft, Port, or Starboard. Sonar Cone-turns a cone that shows the area covered by your transducer on or off. Sonar Data-visually shows the sonar readings received by your transducer for the best combination of sonar and mapping. Tracks-turns the track log on or off. Data Bars-show or hide cruising, navigation, fishing, fuel, or sailing numbers (page 9). Using Fishing Charts Use the Fishing chart for a detailed, unobstructed view of the bottom contours and depth soundings on the chart. Fishing Chart 16 Navigation Chart GPSMAP® 4000/5000 Series Owner's Manual
-
 1
1 -
2
-
3
-
4
-
5
-
6
-
7
-
8
-
9
-
10
-
11
-
12
-
13
-
14
-
 15
15 -
 16
16 -
 17
17 -
 18
18 -
 19
19 -
 20
20 -
 21
21 -
 22
22 -
 23
23 -
 24
24 -
 25
25 -
26
-
27
-
28
-
29
-
30
-
31
-
32
-
33
-
34
-
35
-
36
-
37
-
38
-
39
-
40
-
41
-
42
-
43
-
44
-
45
-
46
-
47
-
48
-
49
-
50
-
51
-
52
-
53
-
54
-
55
-
56
-
57
-
58
-
59
-
60
-
61
-
62
-
63
-
64
-
65
-
66
-
67
-
68
 |
 |
