HP ProLiant BL660c HP Power Regulator for ProLiant servers - Page 9
Performance percent, Power percent, Dynamic Power Savings mode Slow response
 |
View all HP ProLiant BL660c manuals
Add to My Manuals
Save this manual to your list of manuals |
Page 9 highlights
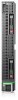
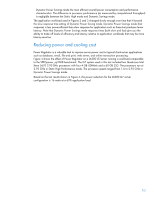
Figure 3 shows the same power and performance comparison for the DL385 G7 server. In this comparison, if you don't require the full performance range of the processors, Static Low Power mode will give you the most power savings until you reach a performance utilization of about 45%. Above this level, the Dynamic Power Savings mode begins to run the processors at the higher P-states to maintain optimal system performance. Figure 3. Power and performance comparison of the DL385 G7 server in Dynamic Power Savings mode (slow and fast response time) and Static modes (Low Power and High Performance) 100 90 80 Power (percent) 70 Static Low Power mode provides 60 greatest power savings below 45% 50 40 30 20 10 0 0 10 20 30 40 50 60 70 80 90 100 Performance (percent) Dynamic Power Savings mode (Slow response) Dynamic Power Savings mode (Fast response) Static High Performance mode Static Low Power mode You can draw several conclusions from these tests: • Static High Performance mode delivers the highest performance at every performance interval up to maximum processor performance (100%), and it always consumes the most power. • Static Low Power mode gives you the best power efficiency below a certain performance level (the level varies by processor type and maker). Static Low Power mode also gives you the best overall power efficiency if you don't require the full performance of the processor. The mode can provide significant power savings with little or no degradation in system performance at these lower utilization levels. Figures 2 and 3 show the processor performance limits for Static Low Power mode in each test. • Because Dynamic Power Savings mode lets the firmware determine the best performance-to-power level, it achieves lower power consumption in low processor-utilization situations, and high performance when the processor reports high levels of utilization. These characteristics give 9
-
 1
1 -
2
-
3
-
 4
4 -
 5
5 -
 6
6 -
 7
7 -
 8
8 -
 9
9 -
 10
10 -
 11
11 -
 12
12 -
 13
13
 |
 |
