Lowrance Elite-7 Ti Operators Manual EN - Page 76
StructureMap, The StructureMap image, Activating Structure overlay - touch
 |
View all Lowrance Elite-7 Ti manuals
Add to My Manuals
Save this manual to your list of manuals |
Page 76 highlights
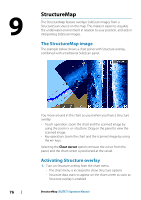
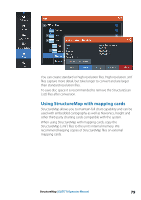
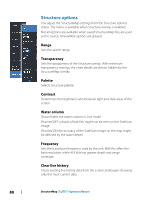
9 StructureMap The StructureMap feature overlays SideScan images from a StructureScan source on the map. This makes it easier to visualize the underwater environment in relation to your position, and aids in interpreting SideScan images. The StructureMap image The example below shows a chart panel with Structure overlay, combined with a traditional SideScan panel. You move around in the chart as usual when you have a Structure overlay: • Touch operation: zoom the chart and the scanned image by using the zoom (+ or -) buttons. Drag on the panel to view the scanned image. • Key operation: zoom the chart and the scanned image by using the +/- keys. Selecting the Clear cursor option removes the cursor from the panel, and the chart center is positioned at the vessel. Activating Structure overlay 1. Turn on Structure overlay from the chart menu - The chart menu is increased to show Structure options - Structure data starts to appear on the chart screen as soon as Structure overlay is enabled 76 StructureMap | ELITE Ti Operator Manual
-
 1
1 -
2
-
3
-
4
-
5
-
6
-
7
-
8
-
9
-
10
-
11
-
12
-
13
-
14
-
15
-
16
-
17
-
18
-
19
-
20
-
21
-
22
-
23
-
24
-
25
-
26
-
27
-
28
-
29
-
30
-
31
-
32
-
33
-
34
-
35
-
36
-
37
-
38
-
39
-
40
-
41
-
42
-
43
-
44
-
45
-
46
-
47
-
48
-
49
-
50
-
51
-
52
-
53
-
54
-
55
-
56
-
57
-
58
-
59
-
60
-
61
-
62
-
63
-
64
-
65
-
66
-
67
-
68
-
69
-
70
-
 71
71 -
 72
72 -
 73
73 -
 74
74 -
 75
75 -
 76
76 -
 77
77 -
 78
78 -
 79
79 -
 80
80 -
 81
81 -
82
-
83
-
84
-
85
-
86
-
87
-
88
-
89
-
90
-
91
-
92
-
93
-
94
-
95
-
96
-
97
-
98
-
99
-
100
-
101
-
102
-
103
-
104
-
105
-
106
-
107
-
108
-
109
-
110
-
111
-
112
-
113
-
114
-
115
-
116
-
117
-
118
-
119
-
120
-
121
-
122
-
123
-
124
-
125
-
126
-
127
-
128
-
129
-
130
 |
 |
