Texas Instruments TI-30X Teachers Guide - Page 110
Sx or Sy, A B C D E - 30xs standard deviation
 |
UPC - 033317198726
View all Texas Instruments TI-30X manuals
Add to My Manuals
Save this manual to your list of manuals |
Page 110 highlights
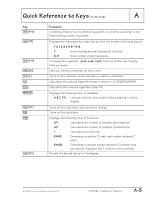
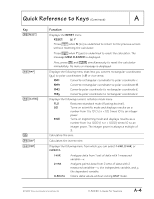
Quick Reference to Keys (Continued) A Key u L @ % \ Function Displays the following menu of stat variables with their current values. n v or w Number of x (or x,y) data points. Mean of all x or y values. Sx or Sy Sample standard deviation of x or y. sx or sy Population standard deviation of x or y. Gx or Gy Sum of all x values or y values. Gx2 or Gy2 Sum of all x 2 values or y 2 values. Gxy Sum of (x Q y) for all xy pairs in 2 lists. a Linear regression slope. b Linear regression y-intercept. r Correlation coefficient. Displays the following menu of variables. A B C D E Lets you select a variable in which to store the displayed value. The new variable replaces any previously stored value. rand Lets you set a seed value for random integers. Calculates the tangent. Calculates the inverse tangent. © 1999 TEXAS INSTRUMENTS INCORPORATED TI-30X ÙS: A Guide For Teachers A-5
-
 1
1 -
2
-
3
-
4
-
5
-
6
-
7
-
8
-
9
-
10
-
11
-
12
-
13
-
14
-
15
-
16
-
17
-
18
-
19
-
20
-
21
-
22
-
23
-
24
-
25
-
26
-
27
-
28
-
29
-
30
-
31
-
32
-
33
-
34
-
35
-
36
-
37
-
38
-
39
-
40
-
41
-
42
-
43
-
44
-
45
-
46
-
47
-
48
-
49
-
50
-
51
-
52
-
53
-
54
-
55
-
56
-
57
-
58
-
59
-
60
-
61
-
62
-
63
-
64
-
65
-
66
-
67
-
68
-
69
-
70
-
71
-
72
-
73
-
74
-
75
-
76
-
77
-
78
-
79
-
80
-
81
-
82
-
83
-
84
-
85
-
86
-
87
-
88
-
89
-
90
-
91
-
92
-
93
-
94
-
95
-
96
-
97
-
98
-
99
-
100
-
101
-
102
-
103
-
104
-
 105
105 -
 106
106 -
 107
107 -
 108
108 -
 109
109 -
 110
110 -
 111
111 -
 112
112 -
 113
113 -
 114
114
 |
 |