Texas Instruments TI-30X Teachers Guide - Page 29
WNBA Stats - 2-Variable, Statistics - calculator
 |
UPC - 033317198726
View all Texas Instruments TI-30X manuals
Add to My Manuals
Save this manual to your list of manuals |
Page 29 highlights
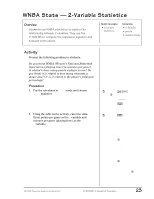
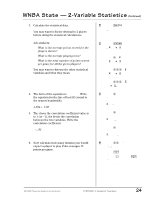
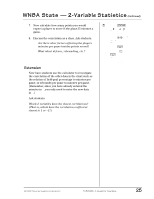
WNBA Stats - 2-Variable Statistics (Continued) 7. Now calculate how many points you would expect a player to score if she plays 35 minutes a game. 8. Discuss the correlation as a class. Ask students: • Are there other factors affecting the players minutes per game besides points scored? • What about defense, rebounding, etc.? Extension Now have students use the calculator to investigate the correlation of the other data in the chart such as the relation of field-goal percentage to minutes per game, or rebounds per game to minutes per game. (Remember, since you have already entered the minutes in Y, you only need to enter the new data in X.) Ask students: Which 2 variables have the closest correlations? (That is, which have the correlation coefficient closest to 1 or –1?) 1. Press u. n Ï Sx Îx Ð 12.00 2. Press ! ! to x¢. x¢ y¢ 3. Press
-
 1
1 -
2
-
3
-
4
-
5
-
6
-
7
-
8
-
9
-
10
-
11
-
12
-
13
-
14
-
15
-
16
-
17
-
18
-
19
-
20
-
21
-
22
-
23
-
 24
24 -
 25
25 -
 26
26 -
 27
27 -
 28
28 -
 29
29 -
 30
30 -
 31
31 -
 32
32 -
 33
33 -
 34
34 -
35
-
36
-
37
-
38
-
39
-
40
-
41
-
42
-
43
-
44
-
45
-
46
-
47
-
48
-
49
-
50
-
51
-
52
-
53
-
54
-
55
-
56
-
57
-
58
-
59
-
60
-
61
-
62
-
63
-
64
-
65
-
66
-
67
-
68
-
69
-
70
-
71
-
72
-
73
-
74
-
75
-
76
-
77
-
78
-
79
-
80
-
81
-
82
-
83
-
84
-
85
-
86
-
87
-
88
-
89
-
90
-
91
-
92
-
93
-
94
-
95
-
96
-
97
-
98
-
99
-
100
-
101
-
102
-
103
-
104
-
105
-
106
-
107
-
108
-
109
-
110
-
111
-
112
-
113
-
114
 |
 |