Texas Instruments TI-30X Teachers Guide - Page 26
Resting, Running, Jumping
 |
UPC - 033317198726
View all Texas Instruments TI-30X manuals
Add to My Manuals
Save this manual to your list of manuals |
Page 26 highlights
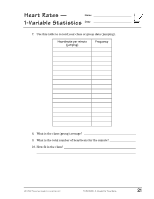
Heart Rates - Name 1-Variable Statistics Date 11. Now make a histogram for each of the 3 sets of data you collected. Resting Running Jumping 12. How are the histograms the same? How are they different 13. Is the data grouped the same or is it more spread out in one graph compared to another © 1999 TEXAS INSTRUMENTS INCORPORATED TI-30X ÙS: A Guide for Teachers 22
-
 1
1 -
2
-
3
-
4
-
5
-
6
-
7
-
8
-
9
-
10
-
11
-
12
-
13
-
14
-
15
-
16
-
17
-
18
-
19
-
20
-
 21
21 -
 22
22 -
 23
23 -
 24
24 -
 25
25 -
 26
26 -
 27
27 -
 28
28 -
 29
29 -
 30
30 -
 31
31 -
32
-
33
-
34
-
35
-
36
-
37
-
38
-
39
-
40
-
41
-
42
-
43
-
44
-
45
-
46
-
47
-
48
-
49
-
50
-
51
-
52
-
53
-
54
-
55
-
56
-
57
-
58
-
59
-
60
-
61
-
62
-
63
-
64
-
65
-
66
-
67
-
68
-
69
-
70
-
71
-
72
-
73
-
74
-
75
-
76
-
77
-
78
-
79
-
80
-
81
-
82
-
83
-
84
-
85
-
86
-
87
-
88
-
89
-
90
-
91
-
92
-
93
-
94
-
95
-
96
-
97
-
98
-
99
-
100
-
101
-
102
-
103
-
104
-
105
-
106
-
107
-
108
-
109
-
110
-
111
-
112
-
113
-
114
 |
 |

© 1999 T
EXAS
I
NSTRUMENTS
I
NCORPORATED
TI-30X
Ù
S: A Guide for Teachers
22
Heart Rates —
1-Variable Statistics
Name
___________________________
Date
___________________________
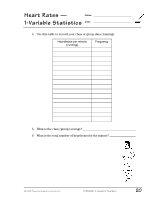
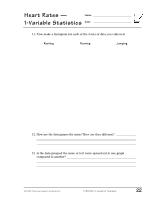
11. Now make a histogram for each of the 3 sets of data you collected.
Resting
Running
Jumping
12. How are the histograms the same? How are they different? _____________
_________________________________________________________________
_________________________________________________________________
13. Is the data grouped the same or is it more spread out in one graph
compared to another?
_____________________________________________
_________________________________________________________________
_________________________________________________________________