Dell PowerEdge SDS 100 Improving NFS performance on HPC clusters with Dell Flu - Page 16
Dell Fluid Cache for DAS health and monitoring, 3. Performance
 |
View all Dell PowerEdge SDS 100 manuals
Add to My Manuals
Save this manual to your list of manuals |
Page 16 highlights
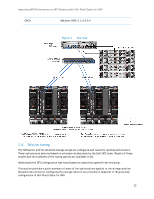
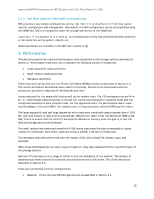
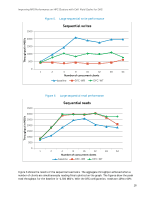
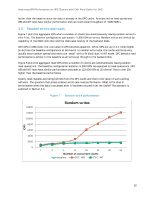
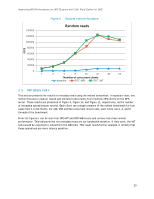
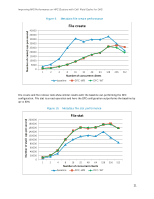
Improving NFS Performance on HPC Clusters with Dell Fluid Cache for DAS 2.5.3. Dell Fluid Cache for DAS health and monitoring DFC provides a very simple command-line utility /opt/dell/fluidcache/bin/fldc that can be used for configuration and management. Alternately, the DFC configuration can be accomplished using the OMSA GUI. DFC is a component under the storage sub-section of the OMSA GUI. /opt/dell/fluidcache/bin/fldcstat is a command-line utility that provides extensive statistics of the cache hits on the system, disk IO, etc. Additional details are available in the DFC User's Guide in [3]. 3. Performance This section presents the results of performance tests conducted on the storage solution described in Section 2. Performance tests were run to evaluate the following common I/O patterns. • Large sequential reads and writes • Small random reads and writes • Metadata operations These tests were performed over the IP-over-InfiniBand (IPoIB) network as described in Section 2.3. The iozone and mdtest benchmarks were used for this study. Details of the benchmarks and test process are provided in Appendix B: Benchmarks and tests. Iozone was used for the sequential tests as well as the random tests. The I/O access patterns are N-toN, i.e., each thread reads and writes to its own file. Iozone was executed in clustered mode and one thread was launched on each compute node. For the sequential tests, the performance metric used was throughput in terms of MiB/s. For random tests, I/O operations per second (IOPS) was the metric. The large sequential read and large sequential write tests were conducted using a request size of 1024 KB. The total amount of data written was 256 GB. (Recall from Table 1 that the NFS server RAM is 128 GB.) This is to ensure that the total I/O exceeds the NFS server memory since the goal is to test the disk and storage solution performance. The small random tests were performed with 4 KB record sizes since the size corresponds to typical random I/O workloads. Each client reads and writes a smaller 4 GB file for these tests. The metadata tests were performed with the mdtest utility and include file creates, stats, and removals. While these benchmarks do not cover every I/O pattern, they help characterize the I/O performance of this storage solution. Each set of tests was run on a range of clients to test the scalability of the solution. The number of simultaneous clients involved in each test was varied from one to 64 clients. The client test bed is described in Section 2.3. Tests were performed on three configurations: • Baseline - This is the pure NFS storage solution as described in Section 2.1. 16
-
 1
1 -
2
-
3
-
4
-
5
-
6
-
7
-
8
-
9
-
10
-
 11
11 -
 12
12 -
 13
13 -
 14
14 -
 15
15 -
 16
16 -
 17
17 -
 18
18 -
 19
19 -
 20
20 -
 21
21 -
22
-
23
-
24
-
25
-
26
-
27
-
28
-
29
-
30
-
31
-
32
-
33
-
34
-
35
-
36
-
37
-
38
 |
 |