Dell PowerEdge SDS 100 Improving NFS performance on HPC clusters with Dell Flu - Page 19
Random writes and reads
 |
View all Dell PowerEdge SDS 100 manuals
Add to My Manuals
Save this manual to your list of manuals |
Page 19 highlights
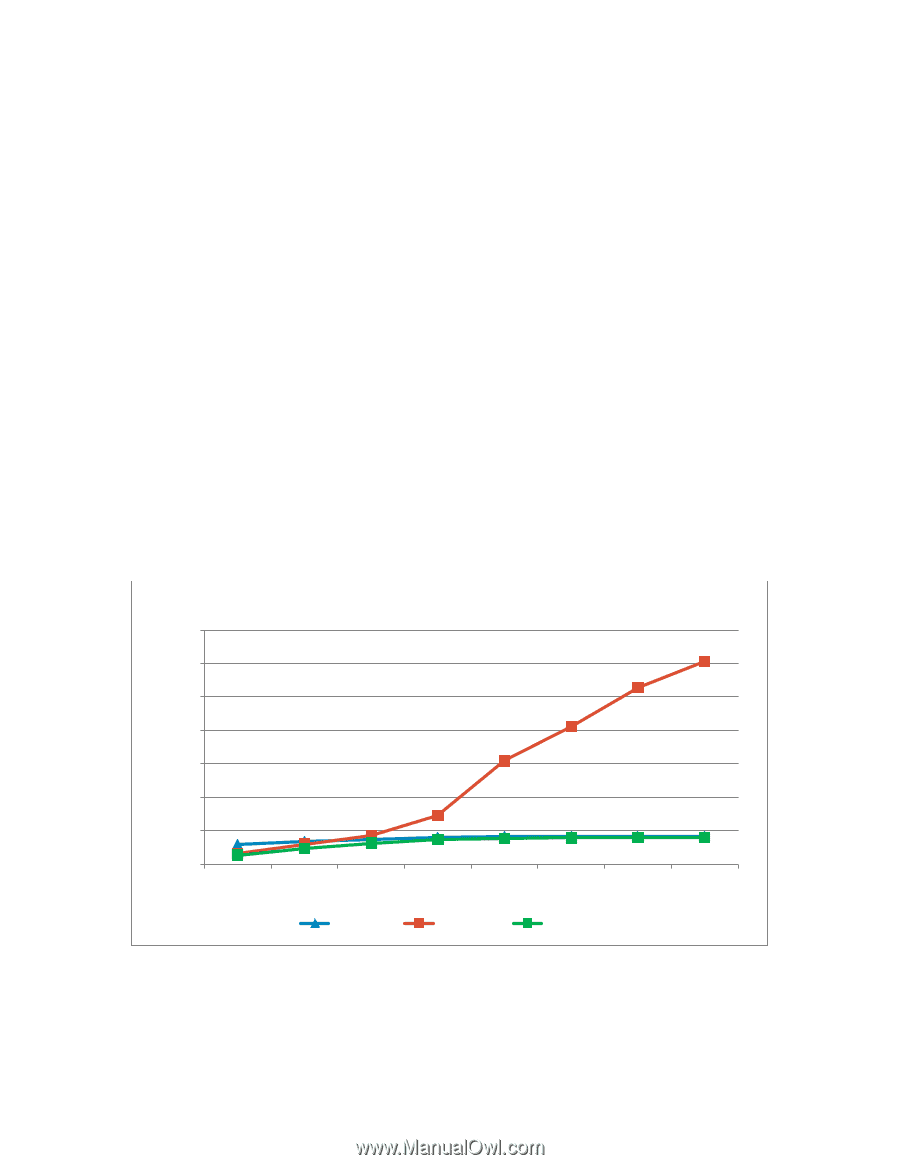
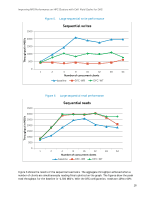
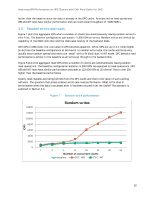
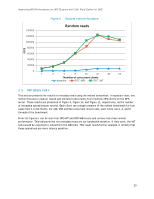
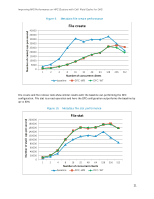
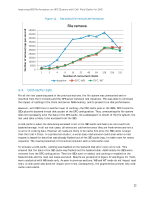
Improving NFS Performance on HPC Clusters with Dell Fluid Cache for DAS better than the baseline since the data is already in the DFC cache. As expected on read operations, WB and WT tests have similar performance and can reach peak throughout of ~3050 MiB/s. 3.2. Random writes and reads Figure 7 plots the aggregate IOPs when a number of clients are simultaneously issuing random writes to their files. The baseline configuration can sustain ~1,600 IOPs on writes. Random writes are limited by capability of the RAID controller and the disks seek latency of the backend disks. With DFC in WB mode, the true value of DFC becomes apparent. Write IOPs are up to 6.4 times higher (6.4x) than the baseline configuration at 64 clients. In random write tests, the cache warms up very quickly since random operations tend to be 'small' with a 4k block size. In WT mode, DFC behavior and performance is similar to the baseline as all writes go through to the backend disk. Figure 8 plots the aggregate read IOPs when a number of clients are simultaneously issuing random read operations. The baseline configuration sustains ~9,300 IOPS. As expected on read operations, DFC WB and WT tests have similar performance and peak at 123,000 IOPs at 32 clients! That is over 20x higher than the baseline performance. Clearly read requests are being fulfilled from the DFC cache and that is the value of such caching software. The question that arises is about worst case read performance. What is the drop in performance when the data is accessed after it has been evicted from the cache? This scenario is explored in Section 3.4. Figure 7. Random write performance IOPS 14000 12000 10000 8000 6000 4000 2000 0 1 Random writes 2 4 8 16 32 48 64 Number of concurrent clients baseline DFC-WB DFC-WT 19
-
 1
1 -
2
-
3
-
4
-
5
-
6
-
7
-
8
-
9
-
10
-
11
-
12
-
13
-
 14
14 -
 15
15 -
 16
16 -
 17
17 -
 18
18 -
 19
19 -
 20
20 -
 21
21 -
 22
22 -
 23
23 -
 24
24 -
25
-
26
-
27
-
28
-
29
-
30
-
31
-
32
-
33
-
34
-
35
-
36
-
37
-
38
 |
 |