Dell PowerEdge SDS 100 Improving NFS performance on HPC clusters with Dell Flu - Page 18
Sequential writes, Large sequential write performance,
 |
View all Dell PowerEdge SDS 100 manuals
Add to My Manuals
Save this manual to your list of manuals |
Page 18 highlights
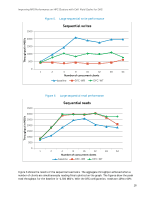
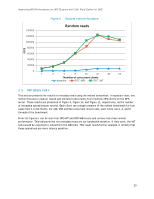
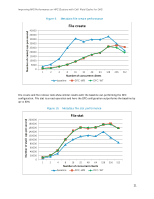
Improving NFS Performance on HPC Clusters with Dell Fluid Cache for DAS Throughput in MiB/s Figure 5. Large sequential write performance Sequential writes 2500 2000 1500 1000 500 0 1 2 4 8 16 32 48 64 Number of concurrent clients baseline DFC-WB DFC-WT Throughput in MiB/s Figure 6. Large sequential read performance 3500 3000 2500 2000 1500 1000 500 0 1 Sequential reads 2 4 8 16 32 48 64 Number of concurrent clients baseline DFC-WB DFC-WT Figure 6 shows the results of the sequential read tests. The aggregate throughput achieved when a number of clients are simultaneously reading files is plotted on the graph. The figures show the peak read throughput for the baseline is ~2,500 MiB/s. With the DFC configuration, reads are 13% to 60% 18
-
 1
1 -
2
-
3
-
4
-
5
-
6
-
7
-
8
-
9
-
10
-
11
-
12
-
 13
13 -
 14
14 -
 15
15 -
 16
16 -
 17
17 -
 18
18 -
 19
19 -
 20
20 -
 21
21 -
 22
22 -
 23
23 -
24
-
25
-
26
-
27
-
28
-
29
-
30
-
31
-
32
-
33
-
34
-
35
-
36
-
37
-
38
 |
 |
Improving NFS Performance on HPC Clusters with Dell Fluid Cache for DAS
18
Large sequential write performance
Figure 5.
Large sequential read performance
Figure 6.
Figure 6 shows the results of the sequential read tests. The aggregate throughput achieved when a
number of clients are simultaneously reading files is plotted on the graph. The figures show the peak
read throughput for the baseline is ~2,500 MiB/s. With the DFC configuration, reads are 13% to 60%
0
500
1000
1500
2000
2500
1
2
4
8
16
32
48
64
Throughput in MiB/s
Number of concurrent clients
Sequential writes
baseline
DFC-WB
DFC-WT
0
500
1000
1500
2000
2500
3000
3500
1
2
4
8
16
32
48
64
Throughput in MiB/s
Number of concurrent clients
Sequential reads
baseline
DFC-WB
DFC-WT