Fluke 434/PWR FE SW43W Users Manual - Page 30
In this example column A time axis and column B Min. Voltage trend 1 are graphed, using the Excel
 |
View all Fluke 434/PWR manuals
Add to My Manuals
Save this manual to your list of manuals |
Page 30 highlights
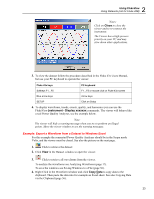
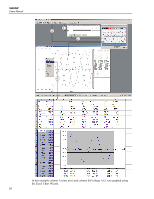
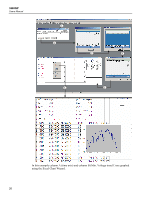
SW43W Users Manual 1 2 3 4 6 5 In this example column A (time axis) and column B (Min. Voltage trend 1) are graphed using the Excel Chart Wizard. 26
-
 1
1 -
2
-
3
-
4
-
5
-
6
-
7
-
8
-
9
-
10
-
11
-
12
-
13
-
14
-
15
-
16
-
17
-
18
-
19
-
20
-
21
-
22
-
23
-
24
-
 25
25 -
 26
26 -
 27
27 -
 28
28 -
 29
29 -
 30
30 -
 31
31 -
 32
32 -
 33
33 -
 34
34 -
 35
35 -
36
-
37
-
38
-
39
-
40
 |
 |

SW43W
Users Manual
26
1
2
3
4
6
5
In this example column A (time axis) and column B (Min. Voltage trend 1) are graphed
using the Excel Chart Wizard.