Fluke 87V Getting Started Guide - Page 18
Bar Graph, Table 6. MIN MAX Functions
 |
View all Fluke 87V manuals
Add to My Manuals
Save this manual to your list of manuals |
Page 18 highlights
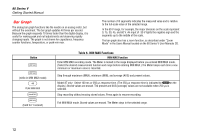
80 Series V Getting Started Manual Bar Graph The analog bar graph functions like the needle on an analog meter, but without the overshoot. The bar graph updates 40 times per second. Because the graph responds 10 times faster than the digital display, it is useful for making peak and null adjustments and observing rapidly changing inputs. The graph is not shown for capacitance, frequency counter functions, temperature, or peak min max. The number of lit segments indicates the measured value and is relative to the full-scale value of the selected range. In the 60 V range, for example, the major divisions on the scale represent 0, 15, 30, 45, and 60 V. An input of -30 V lights the negative sign and the segments up to the middle of the scale. The bar graph also has a zoom function, as described under "Zoom Mode" in the Users Manual located on the 80 Series V User Manuals CD. Button B B (while in MIN MAX mode) E PEAK MIN MAX D B (hold for 1 second) Table 6. MIN MAX Functions MIN MAX Function Enter MIN MAX recording mode. The Meter is locked in the range displayed before you entered MIN MAX mode. (Select the desired measurement function and range before entering MIN MAX.) The Meter beeps each time a new minimum or maximum value is recorded. Step through maximum (MAX), minimum (MIN), and average (AVG) and present values. Model 87 only: Select 100 ms or 250 μs response time. (The 250 μs response time is indicated by pon the display.) Stored values are erased. The present and AVG (average) values are not available when 250 μs is selected. Stop recording without erasing stored values. Press again to resume recording. Exit MIN MAX mode. Stored values are erased. The Meter stays in the selected range. 12
-
 1
1 -
2
-
3
-
4
-
5
-
6
-
7
-
8
-
9
-
10
-
11
-
12
-
 13
13 -
 14
14 -
 15
15 -
 16
16 -
 17
17 -
 18
18 -
 19
19 -
 20
20 -
 21
21 -
 22
22 -
 23
23 -
24
-
25
-
26
-
27
-
28
 |
 |
