Garmin fenix 3 Sapphire with Metal Band Owners Manual - Page 12

About VO2 Max. Estimates

Page 12 highlights

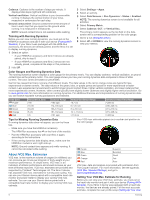
Cadence: Cadence is the number of steps per minute. It displays total steps (right and left combined). Vertical oscillation: Vertical oscillation is your bounce while running. It displays the vertical motion of your torso, measured in centimeters for each step. Ground contact time: Ground contact time is the amount of time in each step that you spend on the ground while running. It is measured in milliseconds. NOTE: Ground contact time is not available while walking. Training with Running Dynamics Before you can view running dynamics, you must put on the HRM-Run accessory and pair it with your device (Pairing ANT+ Sensors). If your fēnix 3 was packaged with the HRM-Run accessory, the devices are already paired, and the fēnix 3 is set to display running dynamics. 1 Select an option: • If your HRM-Run accessory and fēnix 3 device are already paired, skip to step 8. • If your HRM-Run accessory and fēnix 3 device are not already paired, complete all the steps in this procedure. 2 Hold UP. 3 Select Settings > Apps. 4 Select an activity. 5 Select Data Screens > Run Dynamics > Status > Enabled. NOTE: The running dynamics screen is not available for all activities. 6 Select Primary Metric. 7 Select Cadence, GCT, or Vertical Osc.. The primary metric appears as the top field on the data screen with a corresponding position on the color gauge. 8 Go for a run (Going for a Run). 9 Select UP or DOWN to view the running dynamics screen to view your metrics. Color Gauges and Running Dynamics Data The running dynamics screen displays a color gauge for the primary metric. You can display cadence, vertical oscillation, or ground contact time as the primary metric. The color gauge shows you how your running dynamics data compares to those of other runners. The color zones are based on percentiles. Garmin has researched many runners of all different levels. The data values in the red or orange zones are typical for less experienced or slower runners. The data values in the green, blue, or purple zones are typical for more experienced or faster runners. Less experienced runners tend to exhibit longer ground contact times, higher vertical oscillation, and lower cadence than more experienced runners. However, taller runners typically have slightly slower cadences and slightly higher vertical oscillation. Go to www.garmin.com for more information on running dynamics. For additional theories and interpretations of running dynamics data, you can search reputable running publications and websites. Color Zone Purple Blue Green Orange Red Percentile in Zone >95 70-95 30-69 5-29 185 spm 174-185 spm 163-173 spm 151-162 spm

  • 1
  • 2
  • 3
  • 4
  • 5
  • 6
  • 7
  • 8
  • 9
  • 10
  • 11
  • 12
  • 13
  • 14
  • 15
  • 16
  • 17
  • 18
  • 19
  • 20
  • 21
  • 22
  • 23
  • 24
  • 25
  • 26

Cadence
: Cadence is the number of steps per minute. It
displays total steps (right and left combined).
Vertical oscillation
: Vertical oscillation is your bounce while
running. It displays the vertical motion of your torso,
measured in centimeters for each step.
Ground contact time
: Ground contact time is the amount of
time in each step that you spend on the ground while
running. It is measured in milliseconds.
NOTE:
Ground contact time is not available while walking.
Training with Running Dynamics
Before you can view running dynamics, you must put on the
HRM-Run accessory and pair it with your device (
Pairing ANT+
Sensors
). If your fēnix 3 was packaged with the HRM-Run
accessory, the devices are already paired, and the fēnix 3 is set
to display running dynamics.
1
Select an option:
If your HRM-Run accessory and fēnix 3 device are already
paired, skip to step 8.
If your HRM-Run accessory and fēnix 3 device are not
already paired, complete all the steps in this procedure.
2
Hold
UP
.
3
Select
Settings
>
Apps
.
4
Select an activity.
5
Select
Data Screens
>
Run Dynamics
>
Status
>
Enabled
.
NOTE:
The running dynamics screen is not available for all
activities.
6
Select
Primary Metric
.
7
Select
Cadence
,
GCT
, or
Vertical Osc.
.
The primary metric appears as the top field on the data
screen with a corresponding position on the color gauge.
8
Go for a run (
Going for a Run
).
9
Select
UP
or
DOWN
to view the running dynamics screen to
view your metrics.
Color Gauges and Running Dynamics Data
The running dynamics screen displays a color gauge for the primary metric. You can display cadence, vertical oscillation, or ground
contact time as the primary metric. The color gauge shows you how your running dynamics data compares to those of other
runners. The color zones are based on percentiles.
Garmin has researched many runners of all different levels. The data values in the red or orange zones are typical for less
experienced or slower runners. The data values in the green, blue, or purple zones are typical for more experienced or faster
runners. Less experienced runners tend to exhibit longer ground contact times, higher vertical oscillation, and lower cadence than
more experienced runners. However, taller runners typically have slightly slower cadences and slightly higher vertical oscillation. Go
to
www.garmin.com
for more information on running dynamics. For additional theories and interpretations of running dynamics data,
you can search reputable running publications and websites.
Color Zone
Percentile in Zone
Cadence Range
Vertical Oscillation Range
Ground Contact Time Range
Purple
>95
>185 spm
<6.7 cm
<208 ms
Blue
70–95
174–185 spm
6.7–8.3 cm
208–240 ms
Green
30–69
163–173 spm
8.4–10.0 cm
241–272 ms
Orange
5–29
151–162 spm
10.1–11.8 cm
273–305 ms
Red
<5
<151 spm
>11.8 cm
>305 ms
Tips for Missing Running Dynamics Data
If running dynamics data does not appear, you can try these
tips.
Make sure you have the HRM-Run accessory.
The HRM-Run accessory has
on the front of the module.
Pair the HRM-Run accessory with your fēnix 3 again,
according to the instructions.
If the running dynamics data display zeros, make sure the
HRM-Run module is worn right-side up.
NOTE:
Ground contact time appears only while running. It
cannot be calculated while walking.
About VO2 Max. Estimates
VO2 max. is the maximum volume of oxygen (in milliliters) you
can consume per minute per kilogram of body weight at your
maximum performance. In simple terms, VO2 max. is an
indication of athletic performance and should increase as your
level of fitness improves. VO2 max. estimates are provided and
supported by Firstbeat
®
Technologies Ltd. The fēnix 3 device
has separate VO2 max. estimates for running and cycling. You
can use your Garmin device paired with a compatible heart rate
monitor and power meter to display your cycling VO2 max.
estimate. You can use your Garmin device paired with a
compatible heart rate monitor to display your running VO2 max.
estimate.
Your VO2 max. estimate appears as a number and position on
the color gauge.
Purple
Superior
Blue
Excellent
Green
Good
Orange
Fair
Red
Poor
VO2 max. data and analysis is provided with permission from
The Cooper Institute
®
. For more information, see the appendix
(
VO2 Max. Standard Ratings
), and go to
www.CooperInstitute.org
.
Getting Your VO2 Max. Estimate for Running
Before you can view your VO2 max. estimate, you must put on
the heart rate monitor and pair it with your device (
Pairing ANT+
Sensors
). If your fēnix 3 device was packaged with a heart rate
monitor, the devices are already paired. For the most accurate
estimate, complete the user profile setup (
Setting Up Your User
8
Training